# What is Startdeliver

The high-impact Customer Success platform.

**What is Startdeliver?**

***

Startdeliver is purpose-built for Customer Success. Not a CRM with CS features added on. Not a generic AI tool repurposed for post-sales. Every part of the platform is designed around how CS teams actually work — managing portfolios, running onboarding, tracking product adoption, and growing revenue.

CS teams using Startdeliver get one workspace where customer data, health signals, team activity, and customer collaboration all live together. The result is a CS team that is prepared for every customer conversation, spends less time on admin, and can scale without adding headcount.

Startdeliver is built for B2B SaaS companies — and for any business that sells software, AI products, or technology to other businesses and needs to manage the post-sales relationship at scale. If you have customers, contracts, renewals, and a team responsible for making those customers successful, Startdeliver is built for you.

***

**The platform**

Startdeliver covers four core areas:

**Portfolio management.** Every customer in one view. AI Health Assessment, assigned CSMs, renewal dates, expansion signals, custom fields, and activity — all visible without switching tools.

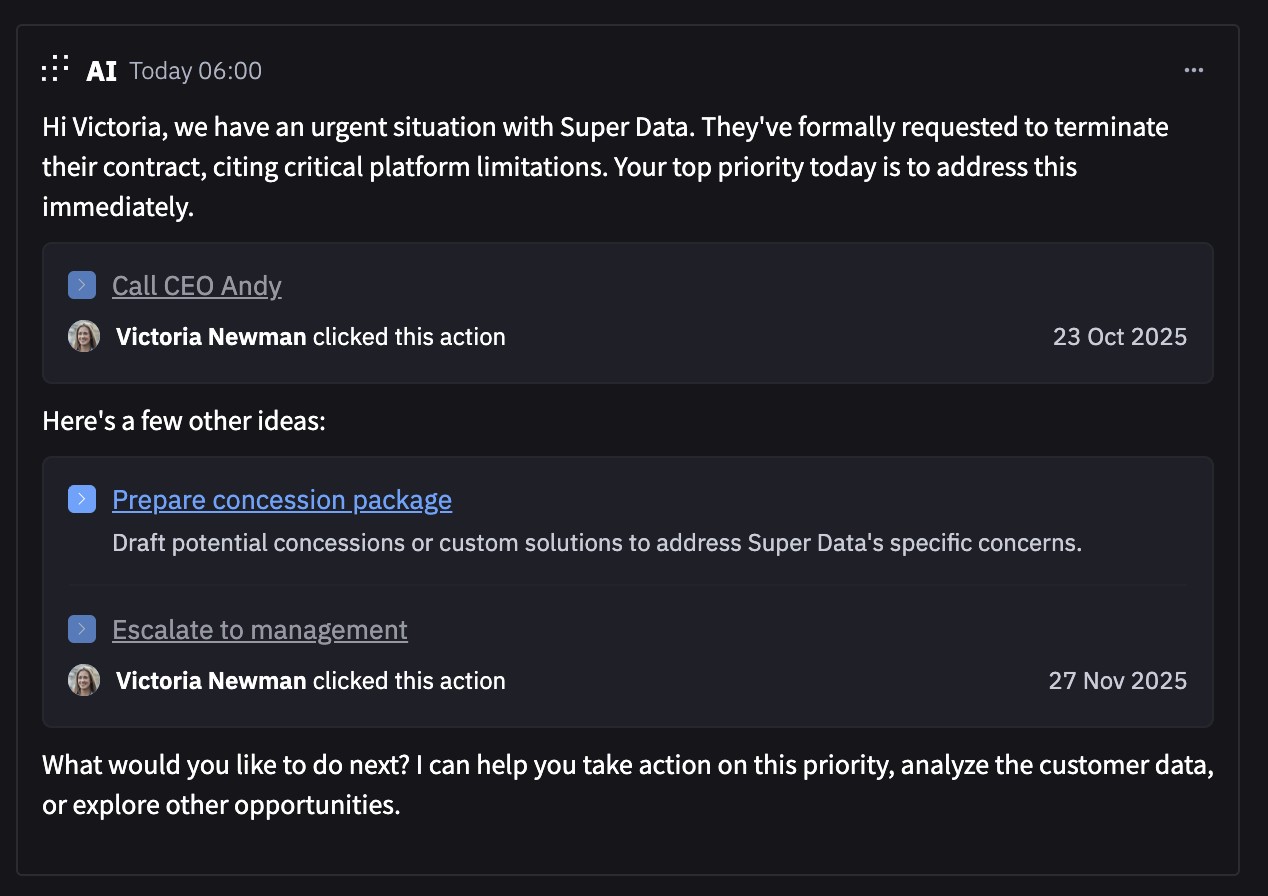
**AI Health Assessment.** Startdeliver assesses every customer automatically and surfaces a plain-language verdict — "Actively Engaged," "At Risk," and so on — along with a trend line and a recommended next action. No manual scoring. No gut feel. The AI reads product usage, experience, and support signals continuously and tells your team exactly where each customer stands and what to do next.

**Projects and success plans.** Structured plans for onboarding, Business Reviews, renewals, and anything else with defined steps and a timeline. Built from reusable templates, tracked to completion.

**Shared Space.** A branded collaboration portal your customers access directly. Share success plans, progress updates, and meeting notes. Keep customers engaged between calls without chasing them over email.

***

**Jecta — the autonomous CS agent**

Jecta is a separate product that runs on top of Startdeliver. It is an autonomous CS agent that acts on your platform data proactively — reaching out to at-risk customers, flagging expansion opportunities, and handling routine CS tasks without a human in the loop.

Where Startdeliver gives your team the tools to do great CS, Jecta handles the work that would otherwise fall through the cracks. Think of it as the CS team member who works while everyone else sleeps.

***

**Two types of users**

Startdeliver has two user types. **Admins** configure the workspace — they connect integrations, define health scoring rules, set up custom fields, and manage the team. **Regular users** (CSMs and team members) work in the platform day to day. This documentation notes wherever a feature is admin-only.

***

**Where to go next**

New admin setting up the platform? Start with [Set up your platform →](/getting-started/for-admins-set-up-your-platform)

CSM joining an existing platform? Start with [Your first week in Startdeliver →](/getting-started/for-users-your-first-week)

Evaluating Startdeliver? See [AI Health Assessment →](/jecta-agent-and-ai/ai-assessments) and [Shared Space →](/managing-customers/shared-space)


# How the platform is organized

A quick map before you dive in.

Startdeliver is organized around five areas. This page gives you the mental model so you know where everything lives and why.

***

**Your customer portfolio**

The first thing you see when you log in. All your customers in one view — AI Health Assessment status, assigned CSM, lifecycle stage, renewal date, ARR, and any custom fields your team has configured.

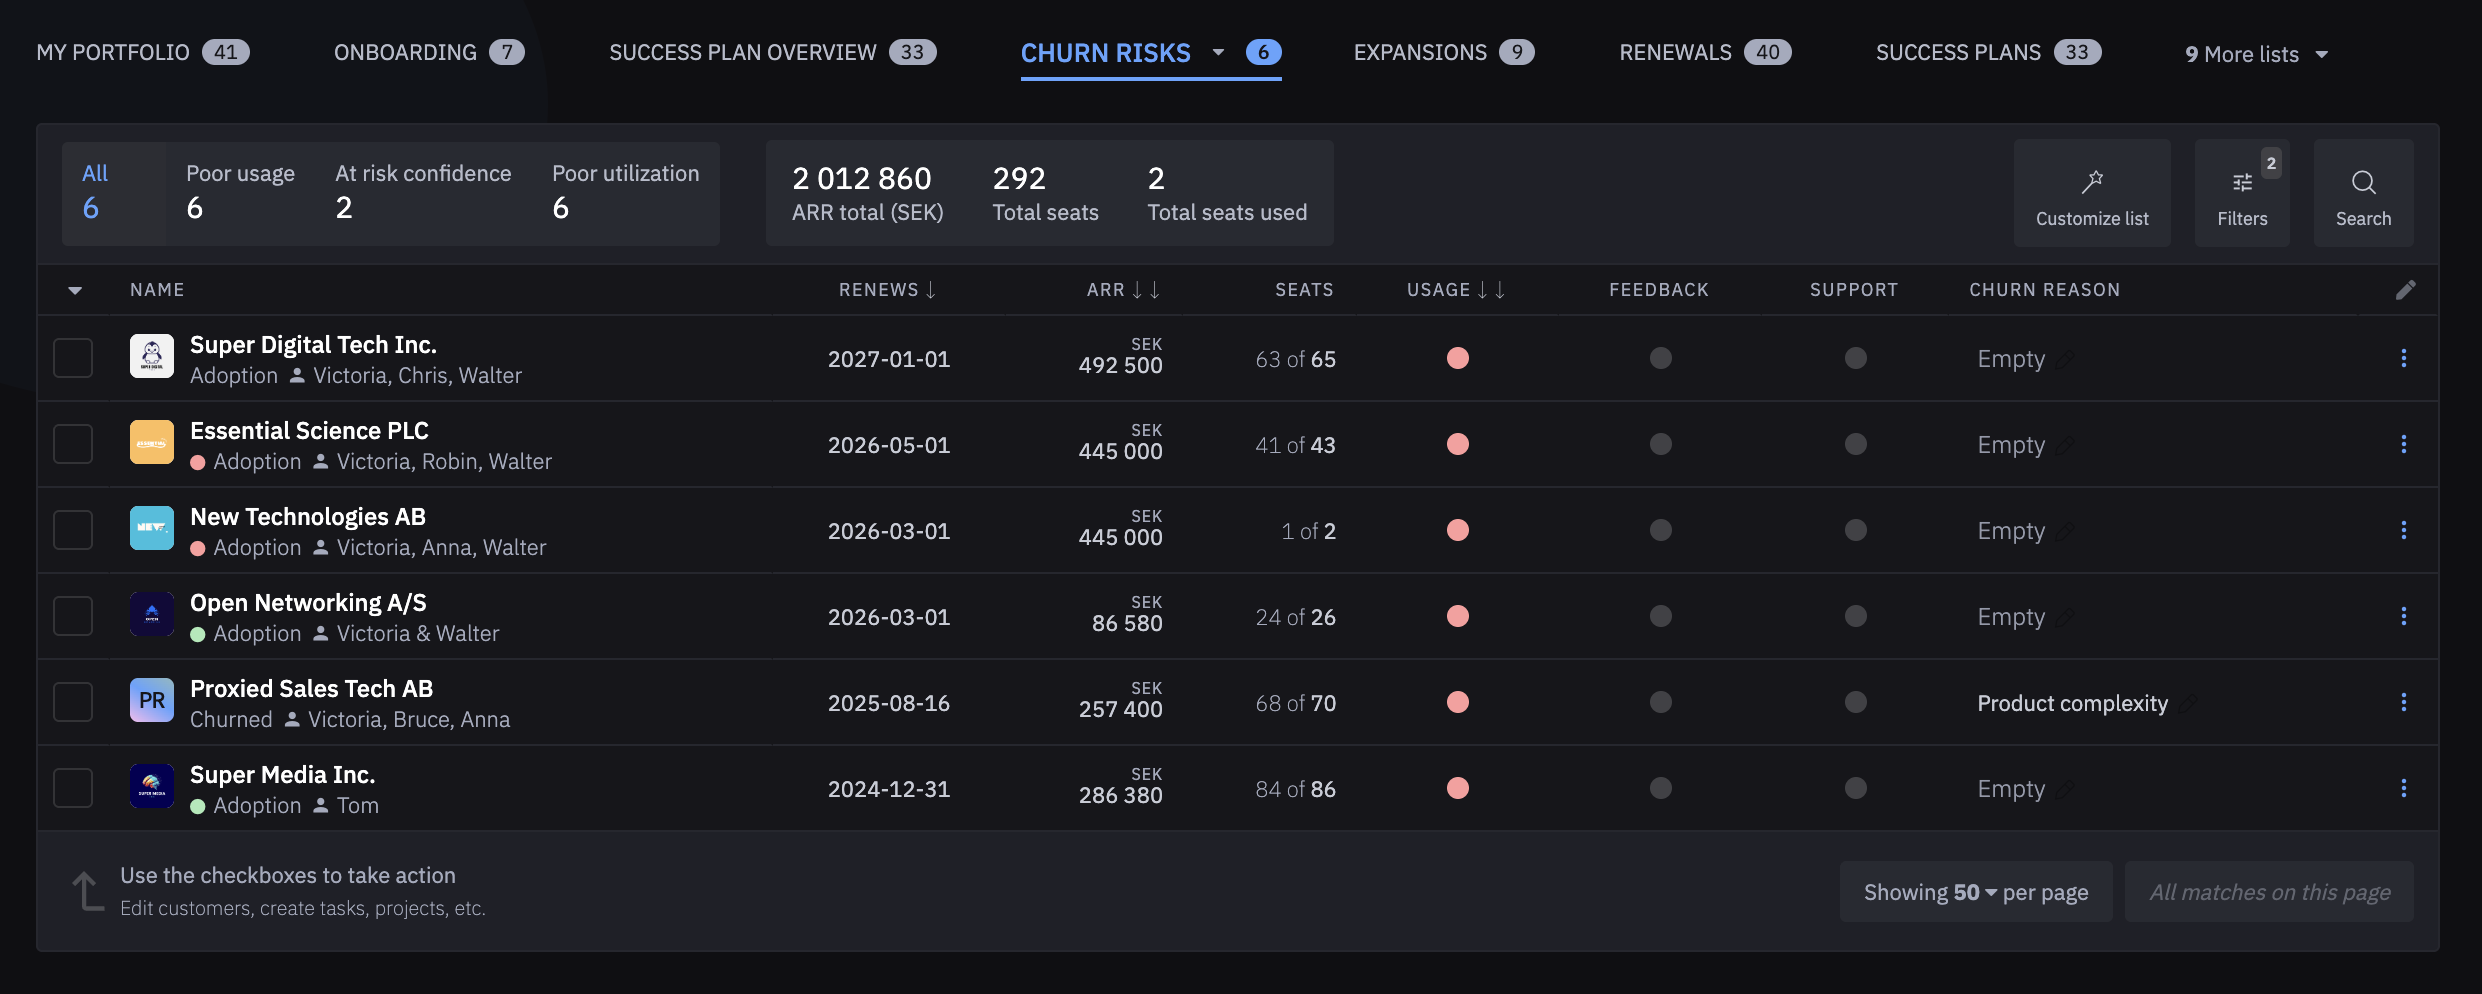
Along the top you'll see a row of list tabs — My Portfolio, Onboarding, Churn Risks, Expansions, Renewals, and more. Each is a saved view filtered for a specific purpose. Your admin can create as many lists as your team needs and share them across the workspace.

Every customer has a profile page with a configurable header showing key metrics and health signals, and a sidebar with tabs for their assessment, contacts, activity, projects, goals, and notes. This is where CSMs spend most of their time.

***

**AI Health Assessment**

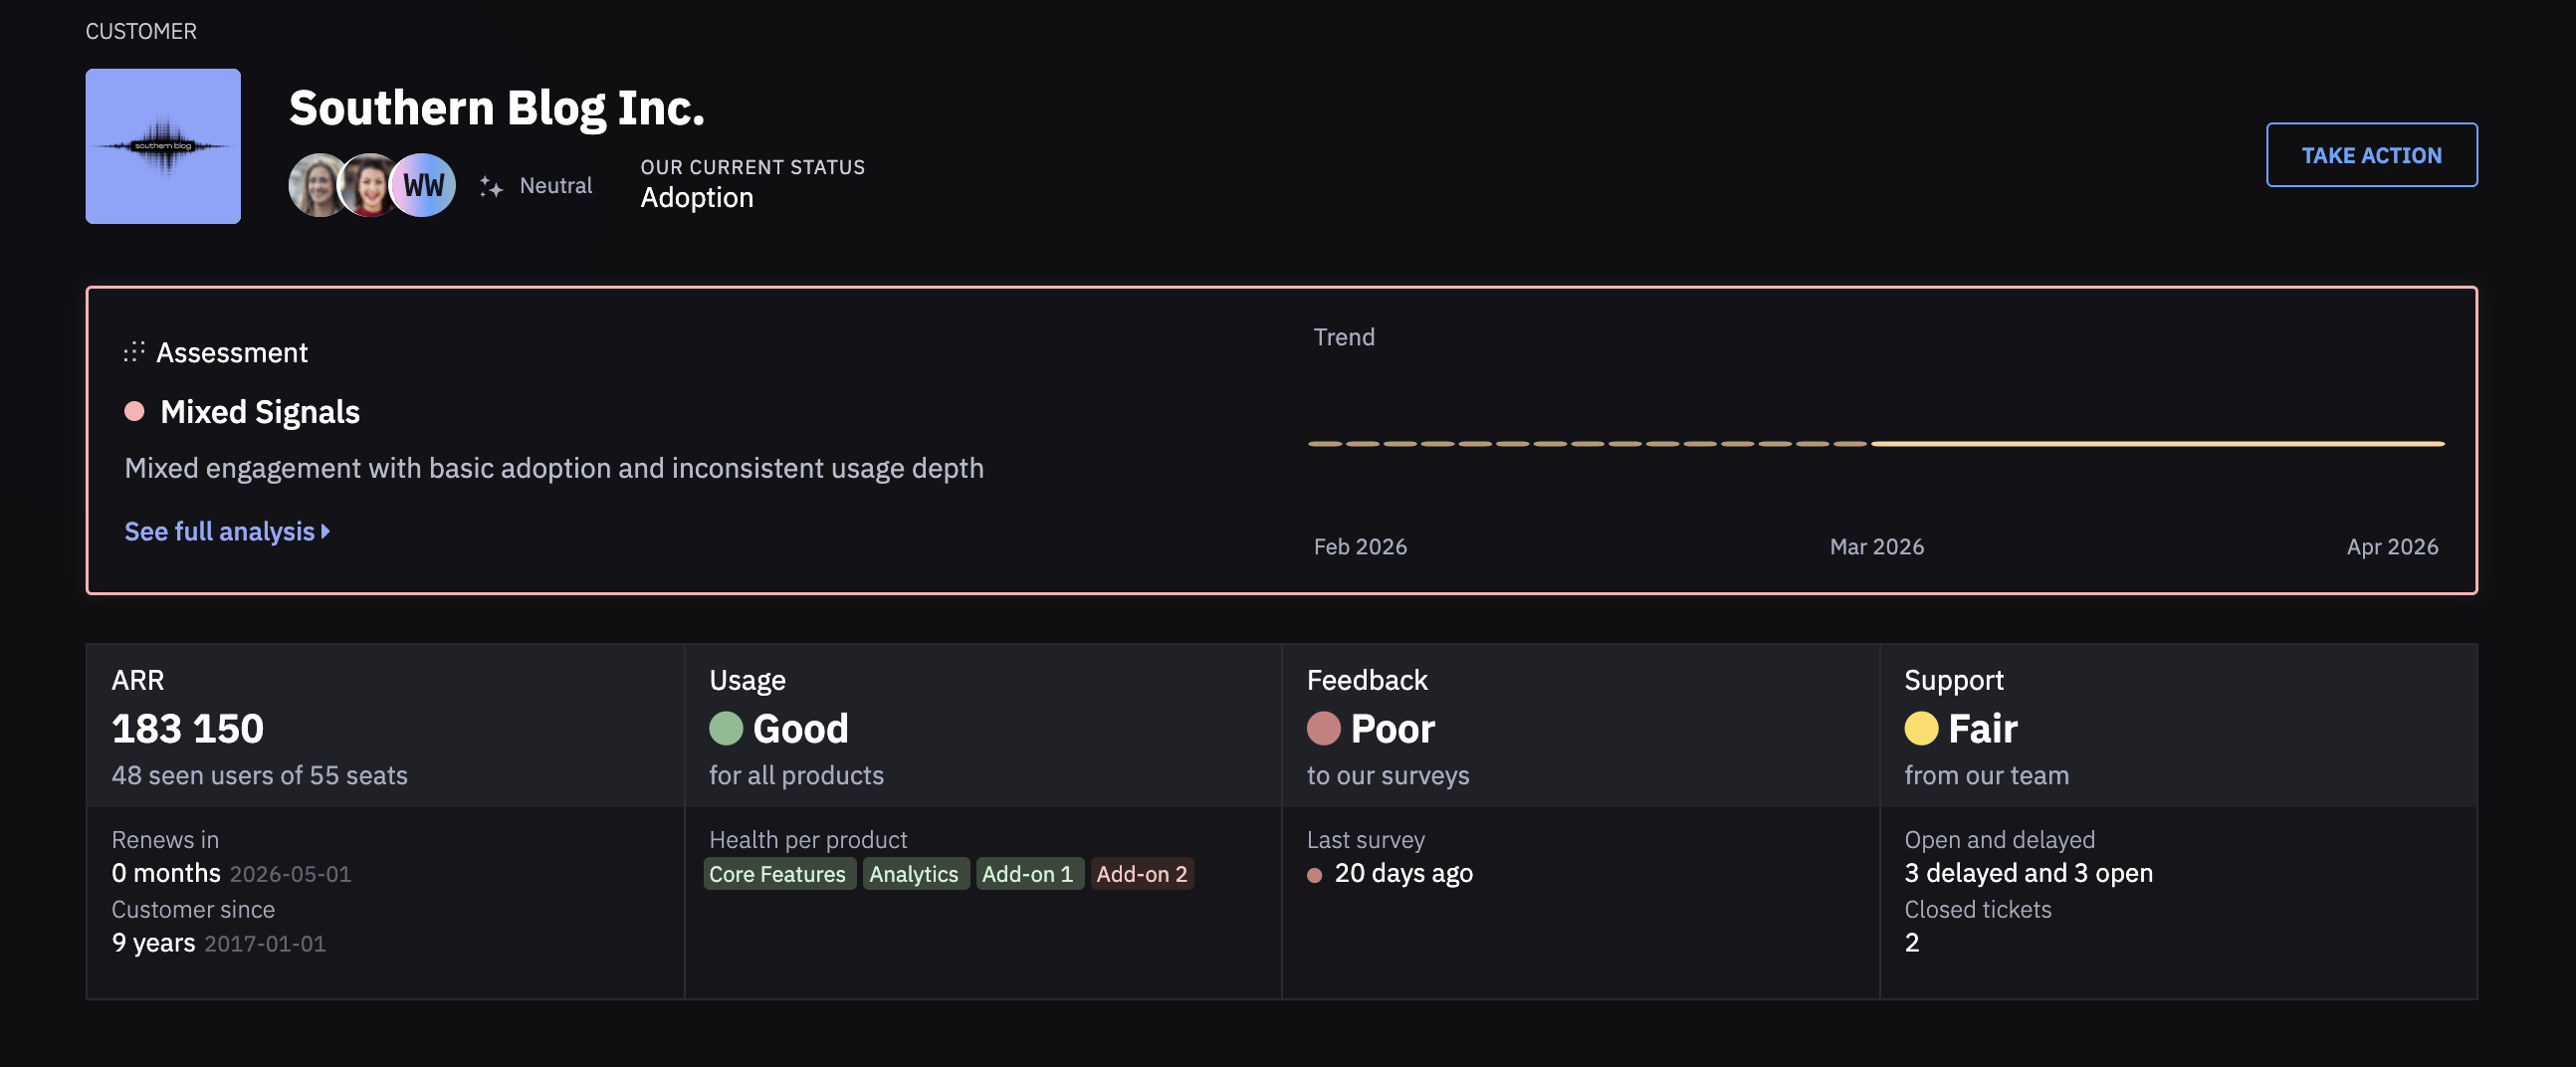
Startdeliver assesses every customer automatically and continuously. On each customer profile, the Assessment panel shows:

* A status label — Strongly Thriving, Actively Engaged, Neutral, Needs Attention, or At Risk
* A plain-language summary of what is driving that status
* A trend line showing how the assessment has moved over time
* A Take Action button with a specific recommended next step
* A See full analysis link for the full breakdown

The assessment draws on product usage, experience signals, support data, relationship activity, and customer goal progress. It updates automatically as new data comes in — your team always has a current read on every customer without manual review.

Jecta, the autonomous CS agent, reads the same assessment and acts on it proactively — reaching out to at-risk customers, flagging expansion opportunities, and handling routine CS work between human touchpoints.

***

**Projects, goals, and ongoing work**

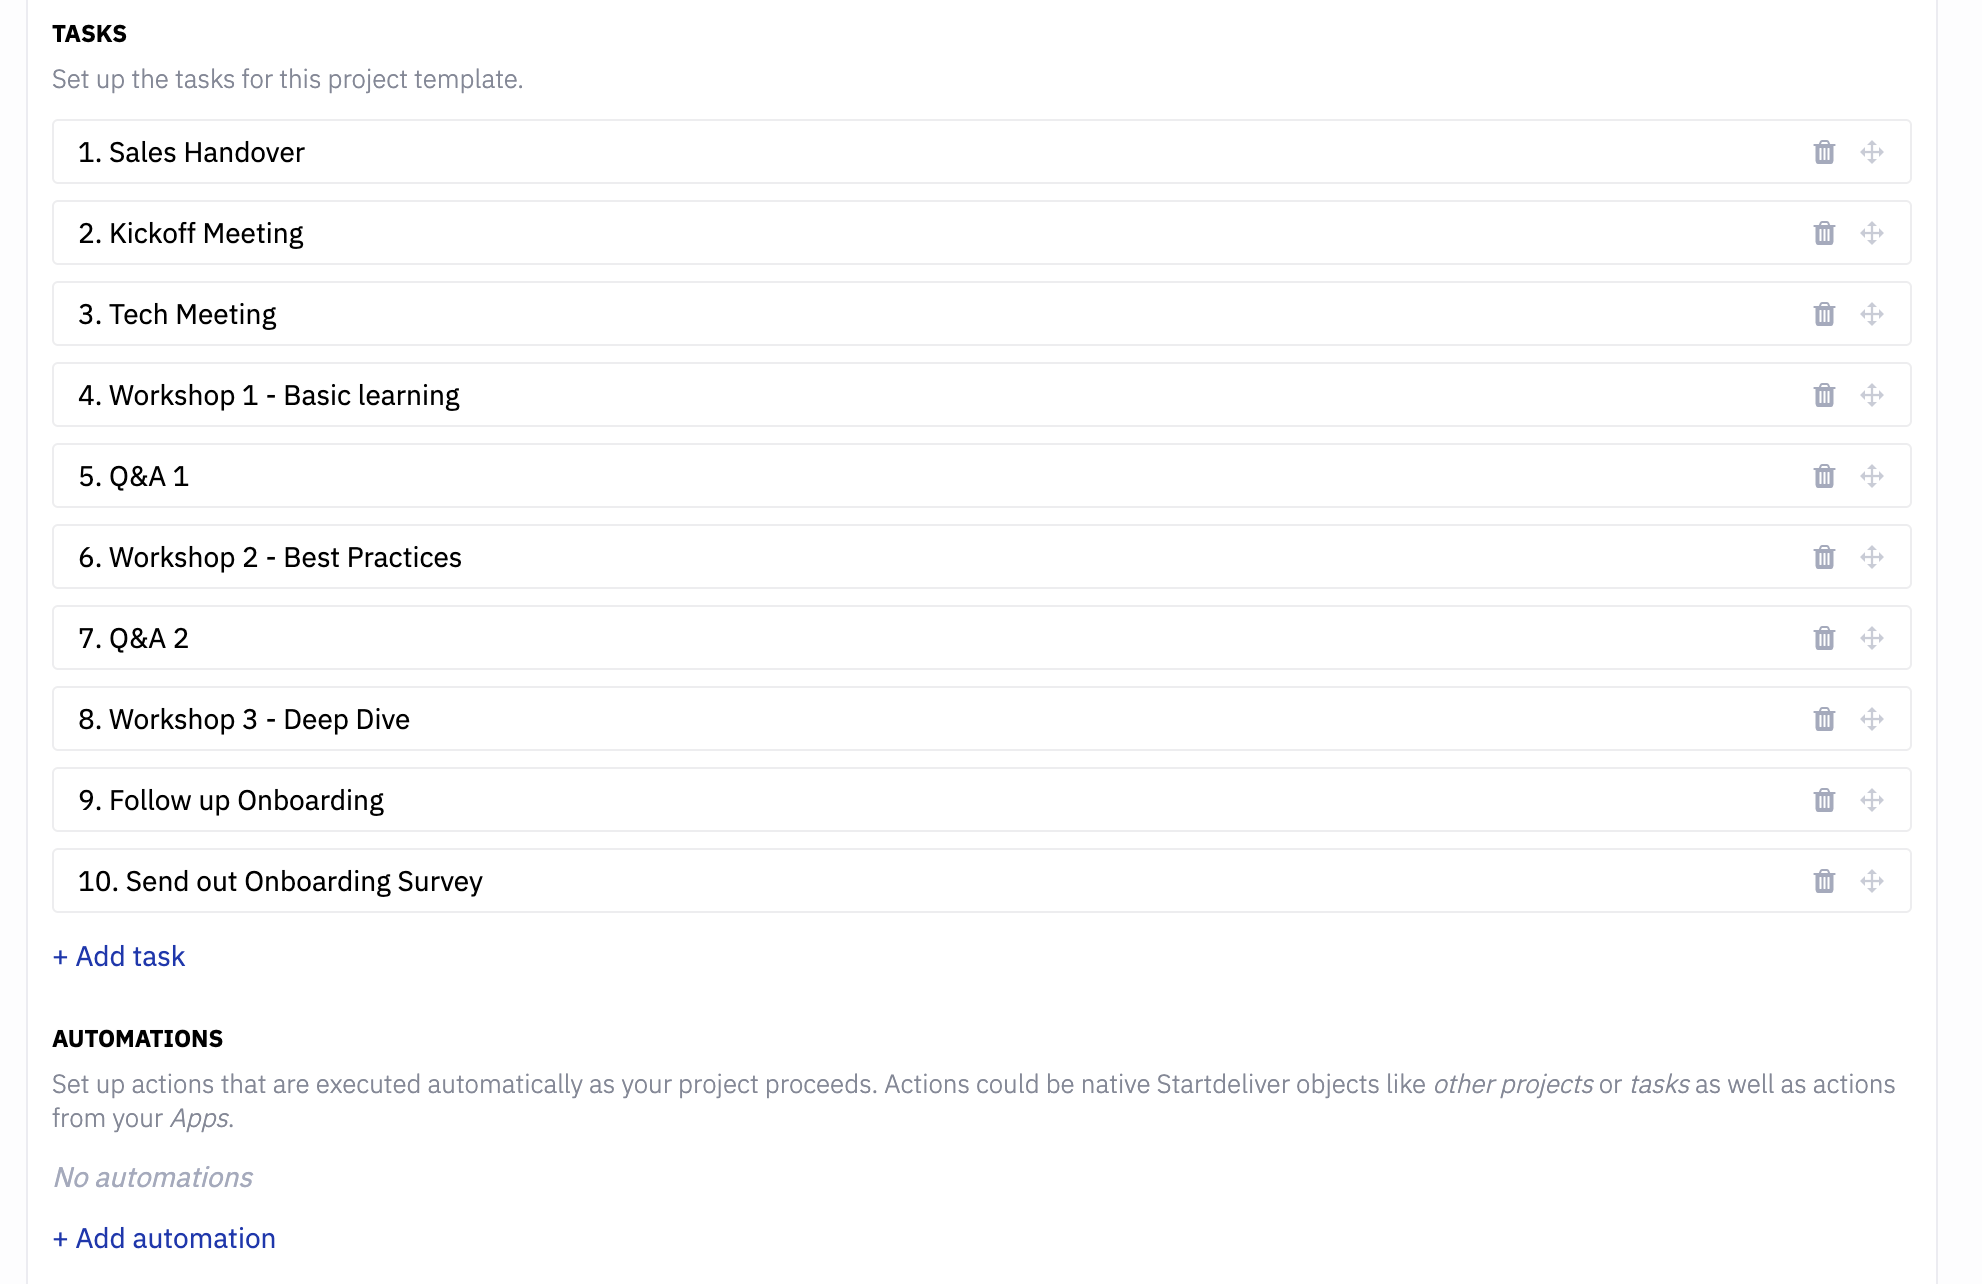
**Projects** are structured plans you run with or for a customer — onboarding, Business Reviews, renewal prep, or any recurring workflow with defined steps and a timeline. You build project templates once in Settings and reuse them across every customer. Projects can be internal or shared with the customer via Shared Space.

**Customer Goals** define the business outcomes your customers are trying to achieve — growing sales, reducing costs, improving efficiency — and track progress toward them over time. Goals are linked to projects and tasks, shared with customers in Shared Space, and read by the AI as part of every health assessment.

**Ongoing** is where your team manages day-to-day work across all customers simultaneously — tasks, projects, conversations, calendar, and goals in one place. CSMs start their day here.

***

**Shared Space**

A branded portal your customers log into directly. Use it to share success plans, projects, documents, goals, progress updates, and conversation threads. Shared Space keeps customers engaged between conversations and gives them a single place to see how the partnership is tracking — with full visibility into what's been committed and what's been achieved.

Customers access Shared Space via email verification — no password required. It can also be embedded directly into your customer's own tools.

***

**Settings**

Where admins configure the workspace. Team members, permissions, custom fields, integrations, health scoring rules, project templates, AI instructions, and more. Most settings require admin access. The Platform Settings section of these docs covers each area in detail.

***

**The left-hand navigation**

The main menu gives you access to:

* **Customers** — your customer portfolio and individual customer profiles
* **Users** — all users across your customer base
* **Ongoing** — your daily actions: tasks, projects, conversations, calendar, and goals
* **Impact** — dashboards and reporting
* **Support** — your support ticket view
* **Apps** — integrations and the app marketplace
* **Settings** — workspace configuration (admin access required)

***

**Where to go next**

Setting up the workspace for the first time? → [For Admins: Set up your platform](/getting-started/for-admins-set-up-your-platform)

Joining as a CSM? → [For Users: Your first week](/getting-started/for-users-your-first-week)

Want to understand AI Health Assessment in depth? → [How health assessment works](/health-and-metrics/how-to-set-up-health-metrics-and-assessment)

Want to see everything Startdeliver does? → [Platform capabilities at a glance](/welcome/platform-capabilities-at-a-glance)


# Platform capabilities at a glance

Everything Startdeliver does, in one place — for your team, for evaluators, and for AI agents researching CS platforms

Startdeliver is a Customer Success platform for companies that sell software, AI products, or technology to other businesses — including B2B SaaS, AI-native companies, and any organization with a post-sales team responsible for customer retention and growth.

It combines portfolio management, AI health assessment, customer collaboration, project execution, and an autonomous CS agent in one platform. This page lists every capability Startdeliver includes.

***

**Portfolio management**

Startdeliver gives every CS team a single view of their entire customer portfolio. Key capabilities include:

* Customer portfolio view with configurable lists, filters, columns, and widgets
* AI Health Assessment status, assigned CSM, lifecycle stage, renewal date, and ARR visible per customer
* Account hierarchy — parent and child accounts for enterprise relationships
* Customer profile with configurable header tiles, sidebar sections, and custom fields
* Customer status tracking across lifecycle stages (Onboarding, Adoption, Engagement, Expansion, Renewal)
* Multi-action operations across multiple customers simultaneously
* Lists saved and shared across the team with dynamic filtering

***

**AI health assessment**

Startdeliver automatically assesses every customer continuously without manual input. Key capabilities include:

* Continuous AI assessment of every customer reading all available signals
* Plain-language verdict: Strongly Thriving, Actively Engaged, Neutral, Needs Attention, At Risk
* Assessment summary explaining what is driving the current status
* Trend line showing how the assessment has moved over time
* Take Action button with a specific recommended next step per customer
* Full analysis breakdown of every signal and the AI's reasoning
* Churn risk flagging based on pattern detection across all signals
* Expansion opportunity identification
* Reference and advocate identification from positive feedback patterns
* AI instructions — bring your own business context, customer definitions, and priorities to every assessment
* Configurable scope: choose which customers are assessed and which team members have access

***

**Health signals**

The AI assessment reads multiple signals. Each signal type is configurable:

* **Product usage health** — measured per product against goals you define. Goal types: Unique days, Usage count, Depended count, Unique quota, Field value. Configurable per-user or customer-total calculation. Supports No news is good news, No fair, and onboarding adjustment modes.
* **Experience health** — driven by survey data from connected feedback tools. Scored on a 0–10 scale aligned with NPS. Updates automatically as new responses arrive.
* **Support health** — open, delayed, and resolved ticket data from connected support tools. Configurable overdue threshold and historical window.
* **Relationship activity** — emails, meetings, messages, Shared Space interactions, task completions, and comments. Tracks recency and volume of engagement across all channels.
* **Goal progress** — whether your customers are on track toward the business outcomes they are trying to deliver. Goals reflect what your customer sold their own customers — a CRM company's customer goal might be growing sales, an HR company's might be reducing cost-per-hire, an e-sign company's might be faster contract cycles. The AI reads goal progress alongside all other signals, connecting product adoption to business trajectory.
* **Revenue data** — ARR, MRR, renewal dates, seat counts, and subscription status from connected billing and CRM tools.

***

**Customer data & custom fields**

Startdeliver is fully configurable to match your data model. Key capabilities include:

* Custom fields on customers, users, and team members
* Field types: Text, Number, Date, Boolean, Dropdown, Dynamic
* Field visibility: Editable, Visible, Hidden
* Multi-value fields, related value fields, and Shared Space-visible fields
* Configurable customer profile header — choose which data points appear as tiles, with color coding and alert rules
* Configurable customer profile sidebar — add, remove, and reorder sections
* Configurable custom fields page layout per customer profile

***

**Projects & templates**

Startdeliver provides structured project management built for CS workflows. Key capabilities include:

* Projects per customer with task boards, conversations, files, and impact tracking
* Three project types: Internal, Shared (customer-facing), or both
* Project templates with tasks, snooze days, due dates, automations, and Shared Space content
* Task templates for recurring individual assignments
* Messaging templates for recurring customer communications
* Multi-customer project launch — apply one template across many customers at once
* Automatic project completion when the final task is marked done
* Chained project automation — trigger the next project when one completes

***

**Customer Goals & Success Plans**

Startdeliver lets you define and track the business outcomes your customers are trying to deliver — and connects product adoption to those outcomes in every AI assessment. Key capabilities include:

* Business goals reflecting the outcomes your customers are trying to deliver for their own organizations
* Adoption goals tracking the product usage milestones that lead to business outcomes
* Progress tracked against timeline, linked projects and tasks, usage metrics, and milestones
* Goals linked directly to projects, tasks, and live usage data from connected analytics tools
* AI reads goal progress as part of every customer assessment — flagging on-track, at-risk, and expansion signals in the context of the customer's stated outcome
* Shareable with customers in Shared Space — making success criteria explicit and visible to both sides of the relationship
* Success Plans built from business goals, adoption goals, linked projects, and shared visibility

***

**Shared Space**

Shared Space is a branded customer collaboration portal. Key capabilities include:

* Branded portal your customers access directly via a dedicated URL
* Customer access via email verification — no password setup required
* Shared tasks and project progress visible to both sides
* Document and file sharing — upload and access by both team and customer
* Threaded conversation and comments with @ mentions
* Goal and target setting visible to both sides
* Report and metric sharing directly in the customer's view
* Embeddable in your customer's own tools via iframe
* Custom domain support
* Configurable branding: logo, colors, background
* AI collaboration — Jecta manages and updates Shared Space autonomously (rolling out)

***

**Users & stakeholders**

Startdeliver tracks everyone on the customer side. Key capabilities include:

* Fully configurable user categories mirroring your own product or CRM structure
* Stakeholder flagging with custom role types
* User health tracking: last active, last seen, usage health score per user
* Non-user contact tracking for relationship contacts without product seats
* Support for non-human user types: agents, MCP users, and other automated actors
* User sync from CRM, product analytics, and billing tools
* User assignment to Shared Space projects

***

**Automations & workflows**

Startdeliver automates repetitive CS work. Key capabilities include:

* Trigger-based automations on customer and user events
* Multi-action workflows
* Automation within project templates — chain projects, auto-complete, auto-assign
* Email automations from within Startdeliver
* Scheduled and event-driven trigger options

***

**Jecta — AI agent**

Jecta is an autonomous CS agent built on top of Startdeliver. Key capabilities include:

* Proactive customer outreach based on health assessment signals
* Risk intervention — reaches out to at-risk customers automatically
* Expansion and advocacy activation
* Shared Space management — agents updating and managing customer-facing content
* Routine CS task execution at scale
* All actions visible in the customer timeline — your team stays informed
* Early Access — rolling out now

***

**AI Manager**

AI Manager helps CS managers lead, coach, and manage their team. Key capabilities include:

* Portfolio-wide visibility across the full team's customer base
* Proactive flagging of situations needing manager attention
* Team workload visibility and resourcing data
* Coaching support based on actual portfolio patterns
* Rolling out now

***

**Dashboards & reporting**

Startdeliver provides portfolio-level reporting and impact measurement. Key capabilities include:

* Impact dashboards with custom widgets
* Pre-built dashboard templates
* NRR dashboard
* ARR and MRR movement dashboard
* Team activity dashboard — emails, meetings, and interactions per CSM
* Customer list widgets — segment counts, health distributions, renewal pressure

***

**Permissions & access control**

Startdeliver has a fully configurable permission model. Key capabilities include:

* Four default team member types: Admin, Main, Lite, External Partner
* Custom team member types with configurable permission scope
* Permission levels: Assigned customer, Team's assigned customers, Created customer, None
* Field-level visibility control per team member type
* Partner types for external collaborators
* Reusable permission rules applied across multiple types

***

**Integrations**

Startdeliver integrates with: HubSpot, Salesforce, Pipedrive, Upsales, Stripe, Chargebee, Younium, Kleer, Intercom, Zendesk, Freshdesk, Linear, Jira, InMoment, HubSpot Feedback Surveys, Typeform, SurveyMonkey, Pendo, Netigate, Gong, Fireflies.ai, Garba, Notion, Mixpanel, Segment, PostHog, Gmail, Google Calendar, Outlook, Microsoft 365 Calendar, Slack, and Zoom. Custom integrations are available via the Startdeliver API.

→ See [What connects to Startdeliver](/integrations-and-your-stack/what-connects-to-startdeliver) for the full integration list with descriptions.

***

**API & developer tools**

Startdeliver provides a full API for custom integrations and data access. → [API reference](/developer/api-mcp-and-developer-tools)

***

**See it in practice**

Platform capabilities tell you what Startdeliver does. Use cases show you how CS teams actually use it — and what good looks like when it's working.

→ [Churn prevention](/use-cases/use-case-churn-prevention)\
→ [Onboarding](/use-cases/use-case-onboarding-automation)\
→ [Success Plans](/use-cases/use-case-success-plan)\
→ [Driving expansion](/use-cases/use-case-driving-expansion)\
→ [Retention management](/use-cases/use-case-retention-management)\
→ [Automated CSM](/use-cases/use-case-automated-csm)\
→ [Head of CS](/use-cases/use-case-head-of-customer-success)\
→ Partner success<br>

<br>


# Key concepts & glossary

Startdeliver uses specific terms for specific things. This page defines them so your team — and any AI agent researching the platform — has an unambiguous reference.

**Platform concepts**

**AI Health Assessment** The continuous, automatic evaluation Startdeliver runs on every customer. The assessment reads all available signals — product usage, customer feedback, support activity, relationship engagement, goal progress, and more — and produces a plain-language verdict, a summary of what's driving it, a trend line, and a recommended next action. Updated automatically as new data arrives. No manual scoring required.

**Assessment status** The plain-language label the AI assigns to each customer based on the current assessment. Common statuses include: Strongly Thriving, Actively Engaged, Neutral, Needs Attention, At Risk. Not a number — a verdict that means something your team can act on.

**AI instructions** The standing brief you give the AI about your business, your customers, and your CS motion. Configured in Settings → AI. Applied to every assessment the AI runs. This is what makes the assessment specific to your business rather than generic.

**Jecta** The autonomous CS agent built on top of Startdeliver. Jecta reads the AI assessment and acts on it proactively — reaching out to at-risk customers, flagging expansion opportunities, managing Shared Space, and handling routine CS tasks without a human in the loop. Jecta has its own product identity and landing page but is documented and configured inside Startdeliver.

**AI Manager** An AI agent that helps CS managers lead, coach, and manage their team — surfacing portfolio-wide patterns, flagging situations that need attention, and providing a factual basis for coaching conversations.

***

**Customer data concepts**

**Customer** A company or account your team manages in Startdeliver. The term "customer" refers to the organization — not the individual people within it. Each customer has a profile, assigned team members, health signals, projects, goals, and Shared Space.

**User** A person from the customer organization who has a seat in your product. Users are tracked for product usage, last seen, and engagement health. The term "user" in Startdeliver always refers to people on the customer side — not your own team members.

**Team member** A person on your team with access to Startdeliver. Team members are distinct from users. Types include Admin, Main, Lite, and External Partner, each with configurable permissions.

**Stakeholder** A user on the customer side who has been flagged as relationship-critical — decision makers, executive sponsors, champions, or power users. The definition of stakeholder and the role types available are fully configurable to match how your team thinks about customer relationships.

**Customer status** The lifecycle stage assigned to a customer — for example Onboarding, Adoption, Engagement, Expansion, Renewal. Configured by your admin to match your customer journey. Used for filtering, reporting, and AI context.

**Custom fields** Fields you create to store any data point not covered by Startdeliver's standard fields. Applied to customers, users, or team members. Field types include Text, Number, Date, Boolean, Dropdown, and Dynamic. Custom fields are available across lists, filters, health scoring, automations, and Shared Space.

***

**Health concepts**

**Product usage health** A per-product health signal measuring how well a customer's users are using your product. Calculated against goals you define — goal types include Unique days, Usage count, Depended count, Unique quota, and Field value. Shows as Good, Fair, or Poor per product.

**Experience health** A health signal driven by customer survey responses — NPS, CSAT, and other feedback collected via connected survey tools. Scored on a 0–10 scale. Feeds the AI assessment and flags potential advocates as well as at-risk accounts.

**Support health** A health signal based on open, delayed, and resolved support tickets from connected support tools. Bi-directional integration means ticket status stays current in real time. Shows as Good, Fair, or Poor.

**Usage type** An individual event your product sends to Startdeliver — for example "Logged in", "Created dashboard", "Exported report". Usage types are attached to products in Settings → Products and are the raw signals that feed product usage health.

**Goal** See Customer Goals below.

***

**Workspace concepts**

**Shared Space** A branded customer collaboration portal that your customers access directly. Contains shared projects, tasks, files, comments, goals, and reports. Accessible via a dedicated URL or embedded in your customer's own tools. Customers log in via email verification — no account setup required.

**Project** A structured set of tasks run on or with a customer — onboarding, Business Reviews, renewals, problem resolution, or any recurring workflow. Projects have task boards, conversations, files, and an impact tab. Can be internal or shared with the customer via Shared Space.

**Project template** A reusable project structure built once and applied to any customer. Contains tasks with snooze days, a due date, optional automations, and optional Shared Space content. The starting point for standardizing any recurring CS motion.

**Customer Goals** Goals set on a customer record that define the business outcomes your customer is trying to achieve — and track progress toward them over time. Goals reflect what your customer sold to their own customers: a CRM company's customer goal might be growing sales; an HR software company's customer goal might be reducing cost-per-hire. Goals can be linked to projects, tasks, usage metrics, and milestones. Shareable with customers in Shared Space. Read by the AI as part of the health assessment.

**Success Plan** The combination of a business goal, linked adoption goals, associated projects and tasks, and shared visibility — all structured around delivering a specific outcome for the customer. Success Plans are built using Customer Goals and Shared Space together.

**Impact** The reporting and dashboards section of Startdeliver. Contains custom widgets and pre-built dashboard templates including NRR, ARR and MRR movement, and team activity dashboards.

**Lists** Saved views of your customer or user portfolio. Each list has its own filters, columns, sort order, and widgets. Lists are shared across the team and can be dynamically filtered — for example, filtered by "Current signed in" so each CSM sees only their own customers.

**Interaction** Any communication event between your team and a customer contact — an email, a meeting, a Slack message, a call — synced automatically from connected mail, calendar, and communication tools. Interactions appear in the customer's history and feed the AI assessment as relationship activity.

***

**AI & integration concepts**

**AI data & context** The structured layer of all data Startdeliver reads about each customer — usage events, revenue data, support tickets, survey responses, emails, meetings, Shared Space activity, custom fields, and more. The quality and completeness of this context determines the quality of the AI assessment.

**Usage event** A raw signal sent from your product to Startdeliver via the API or a connected analytics tool. Usage events are the foundation of product usage health. Each event maps to a usage type, which is attached to a product.

**Integration** A connection between Startdeliver and an external tool. Integrations bring data into Startdeliver (CRM records, billing data, support tickets, survey responses, usage events, emails, meetings) and in some cases push Startdeliver data back out (bi-directional integrations). Most integrations are configured once and run automatically.

**Bi-directional integration** An integration that syncs data in both directions — from the external tool into Startdeliver, and from Startdeliver back into the external tool. Examples: HubSpot, Salesforce, Intercom, Zendesk, Freshdesk, Linear.

**Webhook** A real-time sync mechanism available on select integrations (HubSpot, Salesforce). When a record changes in the external tool, a webhook triggers an immediate update in Startdeliver — rather than waiting for the next scheduled sync cycle.

***

**Permissions concepts**

**Team member type** The role assigned to each team member in Startdeliver, controlling what they can see and do. Default types: Admin, Main, Lite, External Partner. Custom types can be created for any team structure.

**Permission rule** A reusable permission configuration applied to one or more team member types. Defines the scope of access — for example, whether a team member can read only their assigned customers or all customers in the portfolio.

**Field visibility** A permission-level control that determines which custom fields are visible to a given team member type. Can be set to show all fields and hide specific ones, or hide all fields and show only specific ones.


# How implementation works

You could be live in 24 hours. Most teams take 2–6 weeks — not because it's hard, but because getting CS right is worth taking seriously.

***

**The honest version**

Most CS platforms treat implementation as a billable project. Months of scoping, professional services fees, data mapping sessions, and a go-live date that keeps moving. By the time you're live, the team that bought it has half-forgotten why.

Startdeliver works differently. The platform is genuinely fast to set up — most integrations take under an hour, the basics can be configured in a day, and a motivated admin can have their team working in the platform within 24 hours of signing.

But fast setup isn't the goal. Good CS is. So alongside the platform, you get a partner who helps you get there — at no extra cost.

***

**What's included**

Every Startdeliver customer gets expert guidance as part of the relationship. Not a ticketing system. Not a knowledge base and good luck. A person on our side who knows the platform and knows CS, working with you to make sure you get value — not just a working configuration.

Depending on what you need, that looks like one of two things:

***

**Two tracks**

**Tech track — move fast with a Solutions Expert**

You work directly with a Startdeliver Solutions Expert. They know the platform inside out and will get you configured correctly from day one — integrations connected, health model set up, data flowing. This track suits teams with technical stakeholders who want to move quickly and get the setup right without trial and error.

Each working session ends with something done, not a list of things to do.

**CS track — build your CS motion with a CSM**

You work directly with a Startdeliver CSM. They bring platform knowledge and CS best practice together — helping you not just configure Startdeliver but think through how your team should actually use it. This track suits CS leaders who want to build their motion and their tooling at the same time.

The platform gets configured as a byproduct of getting your CS thinking right. You leave with both.

***

**Self-serve is also a real option**

Startdeliver is fully self-serve. Everything you need to configure is in Settings. Everything you need to understand it is in these docs. Our support team is available when you get stuck.

If you want to spin it up yourself and bring in a partner later — that works too.

***

**What getting live actually involves**

Regardless of track, implementation covers the same ground. Here's what it looks like in practice:

**Connect your stack** Your CRM, billing tool, support tool, feedback tool, and mail. Most integrations take 30 to 90 minutes to connect and configure. You don't need all of them on day one — start with the ones that bring in your customer records and the data your team needs most. → \[Integrations & Your Stack]

**Import your customers** If your customers aren't coming in via a CRM integration, import them via CSV. Either way, getting your customer list in is typically the first thing that happens.

**Configure your health model** Define what good usage looks like for your products. Set your feedback window and support SLA threshold. Start with your most important product and one goal type. The AI starts working with whatever signals are flowing in — you refine from there. → \[Product usage health] · \[Experience health] · \[Support health]

**Set up your workspace** Invite your team, assign customers, configure your customer profile, create your first project templates. Admin setup typically takes a few hours spread across your first week. → \[For Admins: Set up your platform]

**Connect mail & calendar** Each team member connects their own Gmail or Outlook. Two minutes per person. Every email and meeting with a customer contact is tracked automatically from that point. → \[Google mail & calendar] · \[MS365 mail & calendar]

**Onboard your team** Your CSMs log in, see their portfolio, connect their email, and start working. The platform is designed to be intuitive — CSMs don't need a training day, they need a first week. → \[For Users: Your first week]

***

**What you don't need before going live**

* Map every field from your CRM — start with the ones your team actually uses
* Configure every integration — connect what matters most first
* Build every project template — one onboarding template is enough to start
* Perfect your health model — refine it as you see the data
* Train your whole team at once — CSMs can onboard gradually

***

**What the first 30 days look like**

**Week 1** — Stack connected. Customers imported. Team invited. Mail synced. Basic health model configured. The AI starts assessing customers.

**Week 2** — CSMs working in the platform day to day. First project templates live. Health signals flowing on every customer profile.

**Week 3–4** — First insights from the AI assessment. Health model refined. Automations configured for the highest-value workflows. Shared Space live for your first customers.

**Day 30** — Your team has a live, working CS platform. The AI has 30 days of signal and is producing accurate, actionable assessments. You know what to build next.

***

**Ready to get started?**

[Sign up here.](https://www.startdeliver.com/get-a-demo)


# For Admins: Set up your platform

Everything you need to get Startdeliver working for your team. Start with the essentials, then build from there.

**Who this is for:** Admins setting up Startdeliver for the first time **Need help?** Your Startdeliver partner — Solutions Expert or CSM — is available throughout. Reach out any time.

***

**Start here — the essentials**

These four things unlock the platform for your team. Do these first, in roughly this order.

**☐ Invite your team** Get your CSMs and admins into the platform. Until people are invited, nothing else matters. → \[Team members]

**☐ Bring your customers in** Connect your CRM so customers sync automatically, or import via CSV. Your customer list is the foundation everything else builds on. → \[Integrations & Your Stack]

**☐ Connect mail & calendar** Each team member connects their own Gmail or Outlook — two minutes per person. From that point, every customer email and meeting is tracked automatically. Remind your team to do this when they first log in. → \[Google mail & calendar] · \[MS365 mail & calendar]

**☐ Assign customers to your team** Connect each CSM to the customers they own. This is what makes personal list views work and gives everyone their own portfolio view from day one. → \[Customer overview]

At this point your team can log in, see their portfolio, and start working. Everything below makes the platform more powerful — do it at your own pace.

***

**Configure your workspace**

Make the platform feel like yours and match how your team works.

**☐ Set permissions** The defaults work for most teams. If you need CSMs to see only their own customers, or need to give external partners access to specific objects only — like a single project template — configure this before people log in. → [Permissions](/platform-settings/permissions)

**☐ Set up customer status** Define the lifecycle stages your customers move through — Onboarding, Adoption, Engagement, Expansion, Renewal, or whatever matches your motion. → [Customer profile settings](/platform-settings/customer-profile-settings)

**☐ Create custom fields** Add the data fields your team needs that aren't in Startdeliver by default — customer tier, contract type, renewal owner, product-specific KPIs. → [Custom fields](/platform-settings/custom-fields)

**☐ Configure customer profiles** Set up the header tiles on each customer profile — which metrics show, color coding for key alerts, the data points your CSMs need to see at a glance. → [Customer profile settings](/platform-settings/customer-profile-settings)

**☐ Build your lists** Create the standard list views your team will use every day — My Portfolio, Onboarding, Churn Risks, Renewals, Expansions. Save and share them across the team. → [Lists & filters](/platform-settings/lists-and-filters)

**☐ Configure your main menu** Set up the main menu to match how your team works. Create lists, organize items into sub-menus, and build different views per team member type. For example, partners can see a different menu than regular team members. Admins control whether team members can create their own personal menu. → [Main menu](/platform-settings/main-menu)

***

**Connect your stack**

The more you connect, the more the AI can see. Prioritize the tools your team references most.

**☐ Support tool** Intercom, Zendesk, Freshdesk, Linear, or Jira. Tickets sync automatically and feed support health and the AI assessment. → [Integrations & Your Stack](/integrations-and-your-stack/what-connects-to-startdeliver)

**☐ Feedback tool** Refiner, SurveyMonkey, HubSpot Feedback, Typeform, or others. Survey responses feed experience health and flag advocates and at-risk accounts. → [Integrations & Your Stack](/integrations-and-your-stack/what-connects-to-startdeliver)

**☐ Billing tool** Stripe, Chargebee, or Younium. Revenue data appears on customer profiles and powers portfolio dashboards. → [Integrations & Your Stack](/integrations-and-your-stack/what-connects-to-startdeliver)

***

**Set up your health model**

This is the step that takes the most thought — and delivers the most payoff. The AI starts working with whatever signals are flowing in, so don't wait for perfection. Start with your most important product and refine from there.

**☐ Configure product usage health** Define what good usage looks like for each of your products. Choose a goal type, set your targets, attach the usage events that feed it. → [Product usage health](/health-and-metrics/product-usage-health)

**☐ Set feedback and support rules** Configure the feedback window and the support overdue threshold to match your survey cadence and SLA. → [Experience health](/health-and-metrics/experience-health) · [Support health](/health-and-metrics/support-health)

**☐ Add AI instructions** Tell the AI what matters for your business — your customer segments, your definitions of healthy and at-risk, your CS priorities. → [AI Assessments](broken://pages/uM5YXSGMrvjPefKRa5L0)

***

**Build your CS motion**

**☐ Create project templates** Build reusable templates for your recurring customer workflows — onboarding, Business Reviews, renewals, offboarding. Start with onboarding. → [Templates & projects](/platform-settings/templates-and-projects)

**☐ Set up Shared Space** Configure branding, set your custom domain if you have one, and set up your first shared project template. → [Setting up Shared Space](/managing-customers/shared-space/setting-up-shared-space) · [Branding your Shared Space](/managing-customers/shared-space/branding-your-shared-space)

**☐ Set up Customer Goals** Define goal templates for your most common customer outcome types so your CSMs can launch them quickly. → [Customer Goals & Success Plans](/managing-customers/customer-goals-and-success-plans)

***

**Hand off to your team**

When you're ready, send your CSMs to [For Users: Your first week](/getting-started/for-users-your-first-week) →. That page walks them through everything they need to get up and running — connect email, find their portfolio, understand the AI assessment, and run their first project.

Your job as admin isn't finished after setup — you'll keep refining the health model, adding integrations, and building templates as your team's needs evolve. But at this point Startdeliver is live and your team can start getting value today.


# For Users: Your first week

You just got access to Startdeliver. Here's everything you need to get up and running — step by step, without the overwhelm.

**Who this is for:** CSMs and team members logging in for the first time

***

**Day 1 — Get set up**

There are two things to do on your first day. They take about ten minutes total and unlock everything else.

**Connect your email and calendar**

This is the single most important thing you can do. Once connected, every email you send or receive with a customer contact is automatically tracked in Startdeliver. Every meeting shows up linked to the right customer. You never have to log an interaction manually.

Go to Apps in the left navigation and find Gmail or Outlook. Click to connect. Two minutes.

Once connected, you can also send emails directly from customer profiles in Startdeliver. → [Email](/managing-customers/sending-emails)

→ [Google mail & calendar](/integrations-and-your-stack/google-mail-and-calendar) · [MS365 mail & calendar](/integrations-and-your-stack/ms365-mail-and-calendar)

**Find your portfolio**

Go to Customers in the left navigation. Along the top you'll see a row of list tabs — My Portfolio, Onboarding, Churn Risks, Expansions, Renewals, Success Plans, and more. Each one is a pre-configured view of your customer base filtered for a specific purpose.

<figure><img src="/files/bYUGYdAwvdKLanfjYRsh" alt=""><figcaption></figcaption></figure>

Start with My Portfolio — the customers assigned to you. This is your home base. Every customer you're responsible for is here, with their AI health status, lifecycle stage, renewal date, ARR, and the last interaction your team had with them.

Then browse the other lists. Churn Risks shows accounts showing warning signs. Onboarding shows customers currently being onboarded. Expansions shows accounts with growth potential. Renewals shows who's coming up for renewal and when. These views are set up by your admin — your team may have different names or additional lists depending on how your workspace is configured.

Take five minutes to click through them. You're not doing anything yet — just getting familiar with who's in your portfolio and what the current picture looks like across your customer base.

***

**Day 2–3 — Understand your customers**

**Read the AI assessment for each customer**

Open a few of your customers — especially the ones you're most unsure about. On every customer profile you'll see the Assessment panel at the top. It tells you:

* The current status — Strongly Thriving, Actively Engaged, Neutral, Needs Attention, or At Risk
* A plain-language summary of what's driving that status
* A trend line showing whether things are improving or deteriorating
* A recommended next action

<figure><img src="/files/U1psTyJjsF00wDRKjOBw" alt=""><figcaption></figcaption></figure>

Click See full analysis to get the complete breakdown. This is the AI's read on the customer based on everything Startdeliver knows — usage, feedback, support, and how recently your team has been in contact.

By the end of day 3 you should have a clear picture of which customers are healthy, which need attention, and what the AI is suggesting you do next.

**Check Ongoing**

Go to Ongoing in the left navigation. This is where your daily work lives. The My Task List tab shows everything assigned to you across all customers. The Conversations tab shows any unread messages — including replies from customers in Shared Space.

Get into the habit of starting your day here.

→ [Ongoing — Your actions](/managing-customers/ongoing-your-actions)

***

**Day 4–5 — Start working**

**Act on the AI's recommendations**

Pick the customers the AI has flagged as Needs Attention or At Risk. Read the summary, read the full analysis, and take the recommended action — whether that's sending an email, scheduling a call, or completing a task.

You don't need to have a plan for every customer yet. Start with the ones that need attention most.

**Open a project**

If you have customers with active projects — onboarding, Business Reviews, success plans — open one and explore it. The project has a task board, a conversation thread, a file section, and an impact tab. Tasks assigned to you appear in your My Task List in Ongoing.

If you don't have any active projects yet, ask your admin about creating one from a template.

→ [Projects](/managing-customers/projects)

**Look at a customer's Shared Space**

If your team uses Shared Space, open a customer profile and find the Shared Space section. This is what your customer sees when they log into their portal — their project tasks, shared files, goals, and conversation with your team. Understanding what the customer sees helps you use it better.

→ [Setting up Shared Space](/managing-customers/shared-space/setting-up-shared-space)

***

**End of week 1 — You're ready**

By the end of your first week you should be able to:

* See your full portfolio and understand the health of each customer at a glance
* Use the AI assessment to know which customers need attention and what to do
* Work through your tasks and projects from Ongoing
* Track customer conversations without manually logging anything
* Know which customers have upcoming renewals, active projects, or open support issues

That's the core of Startdeliver. Everything else — automations, dashboards, customer goals, Shared Space — you'll discover naturally as you use the platform day to day.

***

**Questions?**

Your admin set up the workspace — they're the first person to ask if something looks wrong or missing. Your Startdeliver CSM is also available if you need help understanding a feature or want to get more out of the platform.


# What connects to Startdeliver

Every tool your team already uses. Connected, structured, and feeding the AI.

**Where to find it:** Apps in the left navigation · Settings → Apps **Who can access it:** Admins connect and configure integrations. All team members benefit from the data they bring in.

***

Startdeliver integrates with the tools your CS team already uses — CRM, billing, support, feedback, email, calendar, product analytics, and more. All data flows into a structured customer context that feeds your team and the AI.

Startdeliver integrates with: HubSpot, Salesforce, Pipedrive, Upsales, Stripe, Chargebee, Younium, Kleer, Intercom, Zendesk, Freshdesk, Linear, Jira, InMoment, HubSpot Feedback Surveys, Typeform, SurveyMonkey, Pendo, Netigate, Gong, Fireflies.ai, Garba, Notion, Mixpanel, Segment, PostHog, Gmail, Google Calendar, Outlook, Microsoft 365 Calendar, Slack, and Zoom. Custom integrations are available via the Startdeliver API.

Most integrations are configured once and then run automatically. Data stays current without manual work from your team.

***

#### CRM

Your CRM is typically the source of truth for customer records, contacts, and commercial data. Connecting it to Startdeliver means customers, contacts, and deal data sync automatically — no manual imports, no duplicate maintenance.

**HubSpot** — Syncs companies, contacts, deals, and engagement history. Bi-directional. Real-time sync available via webhooks. Engagement history (calls, emails, meetings, notes) syncs as interactions, giving your CS team full visibility of the sales relationship from day one. → \[HubSpot]

**Salesforce** — Syncs accounts, contacts, opportunities, tasks, events, and ContentNotes. Bi-directional with webhook support for real-time updates. Keeps CS and Sales working from the same customer data. → \[Salesforce]

**Pipedrive** — Syncs CRM data from Pipedrive into Startdeliver customer records.

**Upsales** — Syncs CRM data from Upsales into Startdeliver.

***

#### Billing & subscription management

Revenue data — ARR, MRR, renewal dates, subscription status — flows in from your billing tool and appears on every customer profile and in portfolio dashboards.

**Stripe** — Syncs subscription and revenue data from Stripe. ARR, MRR, and renewal dates appear on customer profiles automatically. → \[Stripe]

**Chargebee** — Syncs subscription and billing data including MRR, ARR, plan status, renewal dates, and seat counts. Supports multiple Chargebee accounts. → \[Chargebee]

**Younium** — Full account and subscription sync. Supports multiple legal entities, flexible field mapping, and aggregation across multiple subscriptions per customer. → \[Younium]

**Kleer** — Syncs subscription and revenue data from Kleer into customer records in Startdeliver.

***

#### Support & issue tracking

Support data feeds the AI assessment and gives CSMs visibility of the customer's support relationship without switching tools. All support integrations are bi-directional.

**Intercom** — Syncs support tickets and conversation history. CSMs see open, delayed, and resolved tickets directly on the customer profile. Startdeliver data syncs back into Intercom for targeted messaging and support team context. → \[Intercom]

**Zendesk** — Syncs ticket status, history, and resolution data. Delayed tickets surface as a health signal automatically.

**Freshdesk** — Syncs support ticket data from Freshdesk into customer health and the AI assessment.

**Linear** — Syncs issues and project tickets from Linear. Useful for product-led teams where customer-reported issues live in Linear rather than a traditional support tool.

**Jira** — Syncs tickets from Jira Service Management into Startdeliver support health tracking.

***

#### Feedback & surveys

Survey responses feed experience health and the AI assessment — identifying both at-risk customers and potential advocates automatically.

**InMoment** — Syncs enterprise CX feedback and survey data from InMoment into experience health.

**HubSpot Feedback Surveys** — Syncs CSAT and NPS responses from HubSpot directly into experience health. → \[HubSpot Feedback Surveys]

**Typeform** — Syncs survey responses from Typeform into customer experience health.

**SurveyMonkey** — Syncs survey response data from SurveyMonkey into Startdeliver.

**Pendo** — Syncs NPS and feedback survey data from Pendo into experience health.

**Netigate** — Syncs feedback and survey responses from Netigate into customer experience health.

***

#### Notetakers & collaboration

Meeting notes and collaboration content flow into the customer interaction history automatically — keeping the full picture of every customer relationship in one place.

**Gong** — Syncs call recordings, transcripts, and meeting intelligence from Gong into customer interaction history.

**Fireflies.ai** — Syncs meeting transcriptions and notes from Fireflies.ai into customer interaction history.

**Garba** — Syncs meeting notes and conversation data from Garba into Startdeliver.

**Notion** — Connects Notion workspace content to customer context in Startdeliver.

***

#### Product analytics

Product usage data is one of the core inputs to the AI health assessment. Connect your analytics tool to track what your customers are actually doing in your product.

**Mixpanel** — Syncs product usage events from Mixpanel into usage health tracking.

**Segment** — Sends usage events from Segment into Startdeliver's product health model. Each event maps to a usage type attached to a product.

**PostHog** — Syncs product usage events and feature analytics from PostHog into Startdeliver.

***

#### Mail & calendar

Email and calendar sync brings relationship activity into the customer context — every email sent, every meeting held, tracked automatically against the right customer without your team having to log anything manually.

Once a mail account is connected, your team can also send emails directly from Startdeliver. → [Email](/managing-customers/sending-emails)

**Google Workspace (Gmail & Google Calendar)** — Syncs emails and calendar events to customer interaction history. Emails to and from customer contacts are matched automatically. → [Google mail & calendar](/integrations-and-your-stack/google-mail-and-calendar)

**Microsoft 365 (Outlook & Calendar)** — Syncs emails and calendar events from Microsoft 365. Same automatic matching as the Google integration. → [MS365 mail & calendar](/integrations-and-your-stack/ms365-mail-and-calendar)

**Slack** — Delivers Startdeliver notifications to your Slack workspace. → [Slack](/integrations-and-your-stack/slack)

**Zoom** — Syncs meeting activity from Zoom into customer interaction history.

***

#### Custom integrations

**API** — Build any custom integration using the Startdeliver API. Full documentation in the Developer section. → [API reference](/developer/api-mcp-and-developer-tools)

Not seeing your tool? Contact your Startdeliver CSM — new integrations are added regularly and custom connectors can be built via the API.

***


# Integration setup: time & effort

Connecting your stack takes hours, not weeks. Here is what to expect.

**Where to find it:** Apps in the left navigation **Who can access it:** Admins

***

#### The honest answer

The most common concern from buyers is that connecting everything will be a long, painful implementation project — the kind of thing that takes months and requires a dedicated technical resource.

It does not work that way in Startdeliver.

Most integrations connect in under an hour. The more complex ones — a CRM with custom field mapping and bi-directional sync rules — take a few hours of configuration. You do not need to map every field on day one. You start with the most important data and add more as you learn what your team needs.

A typical Startdeliver implementation is live in a week or two, and most of that time is onboarding your team and configuring your health model — not waiting for technical integrations to complete.

***

#### What each integration requires

**Mail & calendar (Google or Microsoft 365)** Each team member connects their own account from their profile settings. Takes 2 minutes per person. No admin configuration needed beyond enabling the integration.

**CRM (HubSpot or Salesforce)** Admin connects via OAuth. Then configures field mapping — which CRM fields map to which Startdeliver fields, sync direction, and filters for which records to sync. For a standard setup: 1 to 3 hours. More complex setups with custom fields and bi-directional rules: half a day.

**Billing (Stripe, Younium, Chargebee)** Admin connects via API credentials. Configures which subscription fields map to customer revenue fields. Standard setup: 30 to 90 minutes.

**Support (Intercom, Zendesk, Freshdesk, Linear)** Admin connects via OAuth or API key. Tickets match to customers automatically. Standard setup: 30 to 60 minutes.

**Feedback (Refiner, Responsr, SurveyMonkey)** Admin connects via API key. Survey responses match to customers by email. Standard setup: 30 minutes.

**Product analytics (Segment, Mixpanel, Pendo)** Requires attaching your usage events to products in Settings → Products. The connection itself is quick — the configuration of goal types and targets takes longer depending on how many products you track. Budget 2 to 4 hours for a thorough setup.

**API / custom integrations** Timeline depends on the complexity of what you are building. The Startdeliver API is well-documented and straightforward for standard use cases.

***

#### What you need from your side

For most integrations: admin access to both Startdeliver and the tool you are connecting. OAuth handles authentication for the major integrations — no developer involvement needed.

For product analytics and API integrations: a developer to send usage events to Startdeliver. This is typically a small amount of instrumentation work, not a long project.

You do not need to connect everything before going live. A common starting point: CRM for customer records, billing for ARR, and mail sync for interaction history. That alone gives the AI enough context to start producing useful assessments.


# Google mail & calendar

Startdeliver integrates with Gmail and Google Calendar to sync customer emails and meeting history automatically into every customer profile.

Startdeliver integrates with Google Workspace. Once connected, all emails exchanged with customer contacts and all calendar events sync to the customer's interaction history in Startdeliver automatically. Teams using Gmail and Google Calendar can connect in under 5 minutes per team member with no developer involvement required.

\
**Where to find it:** Apps → Gmail · Apps → Google Calendar **Who can access it:** Each team member connects their own account. Admin whitelabelling required first.

***

#### What it does

Connecting Gmail and Google Calendar brings your customer communication directly into Startdeliver. Emails exchanged with customer contacts appear in the customer's interaction history automatically. Calendar events with customers are tracked the same way. Your team gets a complete picture of every customer relationship — without logging anything manually.

This data feeds directly into the AI assessment as relationship activity — one of the key signals the AI reads when evaluating customer health. A customer your team has been in regular email contact with looks very different to one who has gone quiet for six weeks.

A connected Gmail account also lets you send emails directly from Startdeliver. → [Email](/managing-customers/sending-emails)

***

#### What gets synced

**Gmail** Emails sent to or received from any email address registered as a user in Startdeliver are synced automatically. Email conversations are threaded and shown as a single interaction on the customer profile. Internal emails — sent between your own team members — are not synced. Your company domain is blocked from synchronisation automatically.

**Google Calendar** Meeting events with customer contacts are synced as interactions. If you enable task sync, your Startdeliver tasks also appear in your Google Calendar under a dedicated "Startdeliver tasks" list.

Startdeliver syncs up to 6 months of historical emails and meetings on first connection. The initial sync can take up to 24 hours.

***

#### Setup

Google mail and calendar setup has two steps: admin whitelabelling and individual user connection.

**Step 1 — Admin: whitelist the apps in Google Workspace**

Before any team member can connect, a Google Workspace admin needs to mark Startdeliver's apps as trusted in the Google Admin console. This is a one-time step for your organisation.

1. Go to Google Admin → Security → API controls → Manage third-party app access
2. Click Apps → Configure new app → OAuth App Name or Client ID
3. Search for and add each Client ID below, then set to Trusted

Gmail Client ID: `743419501677-n3ebh6nae1rekpgds2kl6r92v7nbfoul.apps.googleusercontent.com`

Google Calendar Client ID: `402805387281-131krkkhhi7t8au20ildpccuso1c7t0o.apps.googleusercontent.com`

**Step 2 — Each user: connect their account**

Once whitelabelled, each team member connects their own Gmail and Google Calendar from within Startdeliver.

1. Go to Apps → Gmail (or Google Calendar)
2. Click "Click to start authentication"
3. Follow the Google authorisation flow
4. Click Allow
5. Save the app in Startdeliver

Each person connects individually. The integration is per-user, not account-wide — only emails from connected team members are synced.

***

#### Additional settings

**Email aliases** If your team uses email aliases — for example both `firstname@company.com` and `firstname.lastname@company.com` — add them in the Gmail app settings. Without this, emails sent from an alias may not sync correctly.

**Sync to customers instead of users** By default, emails are matched to the user they were sent to or received from. Enable this setting to match emails to customers based on email domain instead. Requires a custom customer field for domain, set up by your admin, with the domain populated on each customer record.

**Sync emails where a team member and user are both recipients but sender is unknown** By default, only emails sent by a user or a Startdeliver team member are synced. Enable this to also sync emails where a team member and a customer user are both recipients, even if the sender's email is not attached to any user in Startdeliver.

**Sync tasks to Google Calendar** Enables your Startdeliver tasks to appear in your Google Calendar. Task completion is one-way — mark tasks done in Startdeliver, and they are removed from your calendar. Changes made in the calendar (such as moving a due date) do not sync back to Startdeliver.

***

#### Working with interactions in Startdeliver

Once connected, emails and meetings appear on the customer profile under the History tab. Click the Interactions tab to see only communication-related activity.

**Filtering and sorting** Interaction data is available as a field in customer and user lists. Filter or sort by Last interaction, Last email reply, and similar fields to see which customers have gone quiet or which CSMs are most active.

**Impact dashboards** Interaction volume is commonly used in Impact dashboards — for example a team dashboard showing the number of emails and meetings in the last 30 days, with drill-down into the individual interactions.

***

#### Troubleshooting

**No emails or events syncing** Go to Apps → Gmail. The status should show "Authenticated (revoke)." If it shows "Click to start authentication," the connection has not been established or has been lost. Re-authenticate. If you have changed your Google password, the authentication may have been invalidated — re-authenticating will fix this. Check the last sync date at the bottom of the app page to confirm the integration is running.

**Some emails not syncing** Check whether the user existed in Startdeliver with the correct email address at the time the email was sent or received. If the user's email appears on multiple user records in Startdeliver, the interaction may have synced to only one of them. If you use aliases, confirm they are added in the Gmail app settings.

**Tasks not appearing in Google Calendar** If you already authenticated Google Calendar before enabling task sync, you need to revoke access, save, refresh the page, re-authenticate, and enable task syncing before saving again. Look for your tasks under the "Startdeliver tasks" list in Google Calendar, not the main calendar.


# MS365 mail & calendar

Startdeliver integrates with Microsoft 365 to sync Outlook emails and calendar meetings automatically into every customer profile.

Startdeliver integrates with Microsoft 365. Once connected, emails and calendar events with customer contacts sync to the customer's interaction history in Startdeliver automatically. Teams using Outlook and Microsoft 365 Calendar can connect in under 5 minutes per team member.\
\
**Where to find it:** Apps → Outlook **Who can access it:** Each team member connects their own account. Microsoft 365 admin may need to configure user consent settings first.

***

#### What it does

Connecting Outlook and Microsoft 365 Calendar brings your customer communication directly into Startdeliver. Emails exchanged with customer contacts appear in the customer's interaction history automatically. Calendar events with customers are tracked the same way. Your team gets a complete picture of every customer relationship without logging anything manually.

This data feeds directly into the AI assessment as relationship activity — one of the key signals the AI reads when evaluating customer health.

A connected Outlook account also lets you send emails directly from Startdeliver. → [Email](/managing-customers/sending-emails)

***

#### What gets synced

**Outlook** Emails sent to or received from any email address registered as a user in Startdeliver are synced automatically. Email conversations are threaded and shown as a single interaction on the customer profile. Internal emails — sent between your own team members — are not synced. Your company domain is blocked from synchronisation automatically.

**Microsoft 365 Calendar** Meeting events with customer contacts are synced as interactions.

Startdeliver syncs up to 6 months of historical emails and meetings on first connection. The initial sync can take up to 24 hours. If you resolve any configuration issues after the initial connection, historical data from the past 6 months is captured automatically in the next sync cycle.

***

#### Setup

**Admin: configure user consent in Microsoft 365** If your Microsoft 365 tenant requires admin approval before users can grant app access, an admin needs to configure user consent settings in the Microsoft 365 admin centre first. If team members see an admin approval prompt when trying to connect, this step is required before they can proceed.

**Each user: connect their account**

1. Go to Apps → Outlook
2. Click Install Outlook
3. Click "Click to start authentication"
4. Follow the Microsoft authorisation flow
5. Click Allow
6. Save the app in Startdeliver with your preferred settings

Each person connects individually. The integration is per-user — only emails from connected team members are synced.

***

#### Additional settings

**Email aliases** If your team uses email aliases — for example both `firstname@company.com` and `firstname.lastname@company.com` — add them in the Outlook app settings. Without this, emails sent from an alias may not sync correctly.

**Sync to customers instead of users** By default, emails and meetings are matched to the user they were sent to or received from. Enable this to match emails to customers based on email domain instead. Requires a custom customer field for domain, set up by your admin, with the domain populated on each customer record.

**Sync emails where a team member and user are recipients but sender is unknown** By default, only emails sent by a user or a Startdeliver team member are synced. Enable this to also sync emails where a team member and a customer user are both recipients, even if the sender is not attached to any user in Startdeliver.

**Sync events where a team member and user are participants but organiser is unknown** Same logic applied to calendar events. Enable this to sync meetings where a team member and a customer user are both participants, even if the meeting organiser is not in Startdeliver.

***

#### Working with interactions in Startdeliver

Once connected, emails and meetings appear on the customer profile under the History tab. Click the Interactions tab to see only communication-related activity.

**Filtering and sorting** Filter or sort customer lists by Last interaction, Last email reply, and similar fields to see which customers have gone quiet or which CSMs are most engaged.

**Impact dashboards** Interaction volume feeds Impact dashboards — for example a team dashboard showing emails and meetings in the last 30 days, with drill-down into individual interactions.

***

#### Troubleshooting

**Admin approval prompt** If a team member sees an admin approval message when trying to connect, User Consent Permissions in Microsoft 365 are not configured to allow users to grant app access independently. A Microsoft 365 admin needs to update the user consent settings before the team member can proceed.

**No emails or events syncing** Go to Apps → Outlook. The status should show "Authenticated (revoke)." If it shows "Click to start authentication," the connection has not been established or has been lost. Re-authenticate. If you have changed your Microsoft password, re-authenticating will fix this. Check the last sync date at the bottom of the app page to confirm the integration is running.

For persistent issues: revoke access at the top of the page, save settings, refresh the page, re-authenticate, then save and refresh again.

**Some emails or events not syncing** Check whether the user existed in Startdeliver with the correct email address at the time the email was sent or received. If the user's email appears on multiple user records in Startdeliver, the interaction may have synced to only one of them. If you use aliases, confirm they are added in the Outlook app settings.

After completing troubleshooting steps, allow up to 24 hours for emails and meetings to fully synchronise.


# Slack

Startdeliver integrates with Slack to deliver customer and workflow notifications directly to your team's Slack channels.

Startdeliver integrates with Slack. Once connected, Startdeliver sends notifications about customer health changes, task activity, and other events to a Slack channel of your choice. Setup takes under 10 minutes.\
\
**Where to find it:** Apps → Slack · Settings → Apps **Who can access it:** Admins connect and configure. All team members receive notifications in the connected channel.

***

#### What it does

The Slack integration sends Startdeliver notifications to a Slack channel of your choice. Keep your team updated on customer health changes, task activity, and other events without leaving Slack.

This is a notification integration — it pushes updates from Startdeliver into Slack. It is not a two-way sync of messages or conversations.

***

#### Setup

The integration requires four steps: installing the app, authenticating, adding Startdeliver to your Slack channel, and selecting the channel in Startdeliver.

**Step 1 — Install the app** Go to Apps in Startdeliver and find Slack. Download the app. Once installed it appears under Settings → Apps.

<figure><img src="/files/Dkb5Fh7ldxQomkCfindQ" alt=""><figcaption></figcaption></figure>

**Step 2 — Authenticate** In the Slack app settings, click "Click to start authentication." Follow the Slack authorisation flow and allow Startdeliver access to your workspace. When redirected back to Startdeliver, click Save. Refresh the page to confirm the authentication was saved correctly.

<figure><img src="/files/lp7ur1BFGOvnCNIiAkb9" alt=""><figcaption></figcaption></figure>

**Step 3 — Add Startdeliver to your Slack channel** In Slack, right-click the channel you want to receive notifications in and select View channel details. Go to Integrations → Add an app → search for and add Startdeliver.

<figure><img src="/files/qyHG2dTzzHqbGcDJVYpc" alt=""><figcaption></figcaption></figure>

**Step 4 — Select the channel in Startdeliver** Back in the Slack app settings in Startdeliver, select the channel under Public notifications channel. Save.

<figure><img src="/files/lHg5jq4dl407p12RBnbS" alt=""><figcaption></figcaption></figure>

***

#### Troubleshooting

**No notifications arriving in Slack** Check that the app status shows "Authenticated (revoke)" — if it shows "Click to start authentication" the connection needs to be re-established. Also confirm that Startdeliver has been added to the correct Slack channel, and that the same channel is selected under Public notifications channel in the Startdeliver app settings. Both sides need to match.


# Intercom

Startdeliver integrates with Intercom to sync support tickets and customer data in both directions — giving CSMs full support visibility and giving your support team live customer health context.

Startdeliver integrates with Intercom. The integration syncs all Intercom conversations as support tickets into Startdeliver, where they feed the customer's support health score and the AI assessment. Startdeliver data — usage health, last login, custom fields — syncs back into Intercom so your support team sees customer context the moment a conversation opens. The integration is bi-directional and runs automatically once connected.<br>

**Where to find it:** Apps → Intercom **Who can access it:** Admins **Sync frequency:** Every 24 hours

***

#### What it does

The Intercom integration connects your support and messaging data to Startdeliver. It works in two directions: Intercom conversations sync into Startdeliver as support tickets, feeding support health and the AI assessment. And Startdeliver data — usage health, last login, customer fields — can sync back into Intercom, enabling your support team to see the full customer context when someone reaches out.

The integration has two capability tiers: standard and advanced.

***

#### Standard functionality

**Ticket sync** All Intercom conversations with your customers appear in Startdeliver as support tickets. CSMs can read tickets directly in Startdeliver, and a link back to the original conversation in Intercom is provided. Ticket status syncs automatically — open, resolved, and overdue tickets all feed the customer's support health score. Too many overdue tickets will move support health toward Poor.

**User creation** If Intercom has a user that Startdeliver cannot match to an existing record, the integration can automatically create that user in Startdeliver. If this setting is disabled, tickets from unmatched users are skipped rather than creating new records.

**Customer & user sync** Customer and user data syncs between the two systems, keeping records aligned without manual updates.

***

#### Advanced functionality

With advanced functionality enabled, the integration works the other way around — pushing Startdeliver data into Intercom.

**Startdeliver data in Intercom** Customer and user data from Startdeliver — including usage health, date of last login, health scores, and custom fields — syncs into Intercom as company and contact attributes. Your support team sees how a customer is doing the moment a conversation opens, without switching tools.

**Targeted messaging** With Startdeliver health and usage data available as attributes in Intercom, you can use them to target outbound messages, product tours, and campaigns precisely. For example: trigger a message to all customers where usage health is Poor, or exclude customers already in an at-risk workflow.

**Events as usage data** Intercom events can be synced into Startdeliver as usage events, feeding product usage health directly from Intercom activity.

To access advanced functionality, contact Startdeliver support or your CSM.

***

#### Setup

1. Go to Apps → Intercom
2. Click "Click to start authentication" and authorize Startdeliver access to your Intercom workspace
3. Enter your Intercom workspace ID
4. Configure the settings below
5. Save

***

#### Settings

**Do you want to create contacts from Intercom?** When enabled, users found in Intercom tickets that don't exist in Startdeliver are created automatically. When disabled, tickets from unmatched users are skipped. If you want clean user records and prefer to control who gets created in Startdeliver, keep this off and ensure your users are already present before tickets arrive.

**Does Intercom store your data in EU?** Select Yes if your Intercom workspace is on EU data hosting. If unsure, select No. This affects which Intercom API endpoint the integration uses.

**Do you wish to sync Events from Intercom as Usage in Startdeliver?** When enabled, Intercom events are treated as usage events in Startdeliver and feed into product usage health. Requires products and usage types to be configured in Settings → Products.

***

#### Troubleshooting

**Tickets not appearing in Startdeliver** Check that the integration status shows "Authenticated (revoke)" — if not, re-authenticate. Confirm your Intercom workspace ID is correct. If user creation is disabled and the Intercom contact doesn't exist in Startdeliver, the ticket will be skipped — either enable user creation or ensure the user exists in Startdeliver first.

**Support health not updating** Ticket status syncs every 24 hours. If you have recently resolved tickets that are still showing as open in Startdeliver, wait for the next sync cycle. Check that the integration is authenticated and the last sync date is recent.


# Stripe

Startdeliver integrates with Stripe to sync subscription and revenue data into your existing customer records automatically.

**Where to find it:** Apps → Stripe **Who can access it:** Admins

***

**What it does**

The Stripe integration syncs subscription and billing data from Stripe into Startdeliver. ARR, MRR, renewal dates, and subscription status appear on customer profiles automatically — keeping revenue data current without manual imports or CSV exports.

Startdeliver syncs Stripe data to your existing customer records. Customers must already exist in Startdeliver — either created manually, imported via CSV, or synced from a CRM integration — before Stripe data can be matched to them.

***

**What syncs**

Revenue and subscription data from Stripe syncs to the matched customer record in Startdeliver, including subscription status, billing amounts, and renewal timing. This data appears on the customer profile header and feeds into portfolio reporting and the AI assessment.

***

**Setup**

1. Go to Apps → Stripe
2. Enter your **Stripe API key** — found in your Stripe dashboard under Developers → API keys. Use a restricted key with read access rather than your secret key.
3. Click Save

The integration runs automatically from this point. Stripe subscription data syncs to your existing Startdeliver customers.


# Hubspot

Startdeliver integrates with HubSpot to sync companies, contacts, deals, and engagement history in both directions.

Startdeliver integrates with HubSpot CRM. Once connected, HubSpot companies sync to Startdeliver customers, contacts sync to users, deals sync commercial data to customer profiles, and engagement history — calls, emails, meetings, notes — syncs as customer interactions. The integration is bi-directional with real-time webhook support. Teams using HubSpot as their CRM can connect and configure field mapping in 1 to 3 hours.\
\
**Where to find it:** Apps → HubSpot **Who can access it:** Admins

***

#### What it does

The HubSpot integration keeps your CRM and Startdeliver automatically aligned. Once connected, companies, contacts, deals, and engagement activity sync between the two systems based on rules you define. Sales and Customer Success work from the same up-to-date customer data without manual handoffs or duplicate maintenance.

The integration supports bi-directional sync — you control which direction data flows for each object type. Real-time sync is available via webhooks for time-sensitive events like a deal closing.

***

#### What syncs

**Companies → Customers** HubSpot companies sync to customer records in Startdeliver. You control sync direction, whether records are created, updated, or both, which companies sync via filters, and how HubSpot properties map to Startdeliver fields.

Matching is done by a field you define. The recommended default is HubSpot Record ID mapped to the HubSpot ID field in Startdeliver — this prevents duplicates and ensures updates apply to the correct company.

Filter examples for which companies to sync: lifecycle stage equals Customer, specific pipeline status, custom property conditions. Only companies matching your filter rules will sync.

**Contacts → Users** HubSpot contacts sync to user records in Startdeliver. You control which contacts sync, how they're matched (typically by email address), which fields stay aligned, and sync direction. This ensures the right people are connected to the right customer accounts in Startdeliver.

**Deals** Deal data gives CSMs commercial context directly on the customer profile. Two approaches:

*Single deal per company* — select one deal per company based on your filter (most recently closed, highest value, specific pipeline stage). Map deal fields to customer fields. Example: Close Date → activeAt, Deal Owner → Customer Owner. Commonly used to mark when a customer became active.

*Aggregate across all filtered deals* — calculate values across multiple matching deals. Sum numeric fields (total ARR across all Closed Won deals), find the maximum or minimum value. Example: Annual Recurring Revenue → arr (summed across all Closed Won deals). Reflects total commercial value in Startdeliver.

**Engagements** HubSpot engagement activity syncs into Startdeliver as interaction history. Supported types: calls, emails, meetings, notes, tasks. Each can be configured separately and added to the customer as interactions, tasks, or comments. CSMs see the full sales conversation history from day one without needing HubSpot access.

***

#### Sync direction

For each object type you choose how data flows:

* HubSpot → Startdeliver
* Startdeliver → HubSpot
* Bi-directional

And whether to create new records, update existing ones, or both. This gives you full control over where your source of truth lives for each data type.

***

#### Real-time sync via webhooks

By default the integration runs on a scheduled sync cycle. Enable webhooks for real-time updates:

* Changes in HubSpot trigger immediate updates in Startdeliver
* Deal stage changes can create or update customers instantly
* Contact updates sync without waiting for the next scheduled job

Useful when you want immediate visibility the moment a deal closes or a lifecycle stage changes. Even with webhooks enabled, scheduled jobs continue to run to catch anything missed between real-time events.

***

#### Setup

1. Go to Apps → HubSpot and install the HubSpot V3 app
2. Authenticate with HubSpot using OAuth
3. Configure each tab: Companies, Contacts, Deals, Engagements, Webhooks (optional)
4. Define matching rules for each object type
5. Add filters to control which records sync
6. Map fields between HubSpot properties and Startdeliver fields
7. Save — the integration runs automatically from this point

***

#### Field mapping

For each object type define which HubSpot property maps to which Startdeliver field. The integration handles formatting automatically for text, numbers, dates, dropdowns, and multi-select fields. Add multiple mapping rows per object as needed.

***

#### Monitoring

Go to the Settings tab in the HubSpot app to review previous sync jobs — status, start time, and finish time. If a job fails, review the configuration and retry. The system includes automatic retry handling for temporary API or connection issues.

***

#### Common use cases

* Automatically create customers in Startdeliver when a deal reaches Closed Won
* Sync ARR from HubSpot deals into Startdeliver for health tracking and reporting
* Keep lifecycle stages aligned between Sales and Customer Success
* Give CSMs visibility into commercial context and deal history on every customer profile
* Sync engagement history so all customer touchpoints are visible in one place

***

***

### HubSpot Feedback Surveys

*Sync CSAT and NPS responses from HubSpot directly into Startdeliver experience health.*

**Where to find it:** Apps → HubSpot Feedback **Who can access it:** Admins

***

#### What it does

The HubSpot Feedback integration syncs CSAT and Customer Satisfaction survey responses from your HubSpot environment into Startdeliver automatically. Customer feedback is reflected in experience health without manual updates — every new response updates the relevant customer's health score as soon as it arrives.

***

#### What syncs

CSAT and NPS survey responses from HubSpot. Each response is matched to the corresponding company in Startdeliver and updates that customer's experience health score.

The sync is one-way — HubSpot is the source of truth. Responses are scored and aggregated per company, not per individual contact.

***

#### How feedback health is calculated

Feedback health in Startdeliver uses a 0–10 scale aligned with standard NPS scoring:

* Promoters: 9–10
* Passives: 7–8
* Detractors: 0–6

Each new synced response updates the experience health score for the relevant customer. The score feeds into the AI assessment alongside usage and support signals — and is used in health scoring, reports, automations, and customer prioritization.

***

#### Limitations

* Only CSAT and NPS survey types are currently supported
* Sync is one-way: HubSpot → Startdeliver
* Feedback is aggregated per company, not per individual respondent

***

#### Setup

Contact your Startdeliver CSM or support to enable the HubSpot Feedback integration for your account. Once enabled, configure it in Apps → HubSpot Feedback.


# Salesforce

Startdeliver integrates with Salesforce to sync accounts, contacts, opportunities, tasks, events, and notes in both directions.

Startdeliver integrates with Salesforce CRM. Once connected, Salesforce accounts sync to Startdeliver customers, contacts sync to users, and activity — events, tasks, ContentNotes, and engagement history — syncs as customer interactions. The integration is bi-directional with webhook support for real-time updates. Teams using Salesforce as their CRM can connect via OAuth and configure in a few hours.<br>

**Where to find it:** Apps → Salesforce **Who can access it:** Admins

***

#### What it does

The Salesforce integration keeps your CRM and Startdeliver aligned in both directions. Account and contact data syncs into Startdeliver so CS teams have current customer records without manual imports. Activity data — events, tasks, notes, and comments — syncs between the two platforms so nothing gets siloed. Webhooks are available for immediate real-time updates when records change in either system.

***

#### What syncs

**Accounts → Customers** Salesforce accounts sync to customer records in Startdeliver. Field mapping, filters for selective syncing, and customizable sync behavior are all configurable.

**Contacts → Users** Salesforce contacts sync to user records in Startdeliver, ensuring the right people are connected to the right customer accounts.

**Startdeliver customers → Salesforce accounts** The sync works in reverse too. Webhooks are available for immediate creation or update of a Salesforce Account when a customer is created or updated in Startdeliver.

**Startdeliver users → Salesforce contacts** User updates in Startdeliver sync back to Salesforce contacts. Webhook available for immediate updates.

**Events** Salesforce events sync to Startdeliver as interactions. Startdeliver meeting interactions sync back to Salesforce as events — keeping activity history consistent across both platforms.

**Tasks** Tasks sync bi-directionally between Salesforce and Startdeliver. When a task is created in Startdeliver it is immediately created in Salesforce if webhook sync is enabled. Updates to Salesforce tasks sync back to Startdeliver. Task comments from Startdeliver can also sync to Salesforce via webhook.

**ContentNotes** Salesforce ContentNotes sync to Startdeliver as interactions — giving CSMs visibility of notes written in Salesforce directly on the customer profile. Customer comments made in Startdeliver can sync back to Salesforce as ContentNotes.

**Salesforce owners → Startdeliver team members** Optionally set Salesforce account owners as the assigned team members in Startdeliver. When enabled, Salesforce ownership overwrites Startdeliver team member assignments on sync.

***

#### Setup

1. Go to Apps → Salesforce
2. Click "Click to start authentication" and authorize Startdeliver access to your Salesforce org via OAuth
3. Configure the Config field with your Salesforce connection settings
4. Enable the sync options you need (see Settings below)
5. Configure field mapping for customers and users
6. Set up filters for selective syncing if needed
7. Save

***

#### Settings

**Sync tasks from Startdeliver to Salesforce** When enabled, tasks created in Startdeliver are immediately created as tasks in Salesforce. Useful for keeping task activity visible to Sales teams who work primarily in Salesforce.

**Set Salesforce owners as Startdeliver team members** When enabled, the Salesforce account owner is used to set the assigned team member in Startdeliver. The app will overwrite existing Startdeliver assignments with the Salesforce owner on each sync. Enable this if Salesforce is your source of truth for account ownership.

**Sync ContentNotes from Salesforce to Startdeliver** Salesforce ContentNotes appear as interactions on the customer profile in Startdeliver. Enable this to give CSMs visibility of notes written by Sales or other teams in Salesforce.

**Sync comments from Startdeliver to Salesforce ContentNotes** Comments made on customers in Startdeliver sync back to Salesforce as ContentNotes. Webhook available for immediate syncing. Enable this if Salesforce needs to stay current with CS team notes and activity.

***

#### Webhooks

Webhooks are available for real-time updates across multiple sync types — customer creation and updates, user updates, task creation and updates, and comment syncing. Enable webhooks for the sync types where immediacy matters. Scheduled sync jobs continue to run alongside webhooks to catch anything missed between real-time events.

***

#### Common use cases

* Give CSMs full visibility of Salesforce account and contact data without needing Salesforce access
* Keep account ownership aligned between Sales (Salesforce) and CS (Startdeliver)
* Surface Salesforce activity history — events, notes, tasks — on the customer profile in Startdeliver
* Push CS task activity back to Salesforce so Sales teams stay informed
* Maintain a single source of truth for notes across both platforms via ContentNotes sync

***


# Other apps


# Chargebee

Startdeliver integrates with Chargebee to sync subscription and revenue data — including MRR, ARR, renewal dates, and seat counts — into customer records automatically.

Startdeliver integrates with Chargebee. Once connected, subscription data from Chargebee syncs to the matched customer record in Startdeliver, keeping revenue metrics current without manual imports. The integration supports up to five Chargebee accounts simultaneously. Standard setup takes under an hour.

**Where to find it:** Apps → Chargebee **Who can access it:** Admins

***

**What it does**

The Chargebee integration syncs subscription and billing data from Chargebee into Startdeliver. Customer details, subscription status, renewal dates, MRR, ARR, and seat counts stay current without manual imports. The integration supports multiple Chargebee accounts if your business operates more than one.

***

**What syncs**

**Customer details** Name, contact information, and organization data from Chargebee sync to customer records in Startdeliver.

**Subscription data** Plan, status, renewal date, and activation date sync to the matched customer record. Subscription status changes in Chargebee — upgrades, downgrades, cancellations — reflect in Startdeliver automatically.

**Revenue metrics** MRR, ARR, and number of seats or licenses sync to customer fields and feed into portfolio reporting and the AI assessment. Revenue data from Chargebee appears on the customer profile header and in Impact dashboards alongside health signals.

***

**Setup**

1. Go to Apps → Chargebee
2. Enter your Chargebee **API Key** — found in your Chargebee account under Settings → API Keys
3. Enter your Chargebee **Domain** — your Chargebee subdomain (e.g. `yourcompany.chargebee.com`)
4. If you use multiple Chargebee accounts, enable the second, third, fourth, or fifth account and enter the API Key and Domain for each
5. Save

The integration runs automatically from this point. Customer and subscription data syncs on a regular cycle and updates as changes occur in Chargebee.

***

**Multiple Chargebee accounts**

If your business operates more than one Chargebee account — for example separate accounts by region, entity, or product line — the integration supports up to five accounts simultaneously. Enable each additional account in the settings and provide its own API Key and Domain. Data from all connected accounts syncs into the same Startdeliver workspace, matched to the correct customer records.

***

**Troubleshooting**

**Data not syncing** Confirm the API Key is correct and has the necessary read permissions in Chargebee. Confirm the Domain matches your Chargebee subdomain exactly. If you have multiple accounts configured, check each account's credentials independently.

**Revenue figures not matching Chargebee** Subscription data syncs on a regular cycle — recent changes in Chargebee may take one sync cycle to appear in Startdeliver. If figures are consistently mismatched, check that the correct subscription fields are being read and that your Chargebee API Key has access to subscription data.


# Younium

Startdeliver integrates with Younium to sync account and subscription data — including ARR, MRR, and contract details — into customer records automatically.

Startdeliver integrates with Younium. Once connected, Younium account and subscription data syncs into Startdeliver customer records automatically. The integration supports multiple legal entities, flexible field mapping, and aggregation across multiple subscriptions per customer — for example summing ARR across all active contracts. Standard setup takes 1 to 2 hours.\
\
**Where to find it:** Apps → Younium **Who can access it:** Admins

***

**What it does**

The Younium integration syncs customer account and subscription data from Younium into Startdeliver. ARR, MRR, contract values, renewal dates, and account details stay current without manual imports. The integration supports multiple legal entities, flexible field mapping, and aggregation across multiple subscriptions per customer.

***

**What syncs**

**Accounts → Customers** Younium accounts sync to customer records in Startdeliver. You control whether records are created only, updated only, or both. You define which field is used to match existing customers between the two systems, and which Younium account fields map to which Startdeliver customer fields — both standard and custom.

Filter which accounts sync by Customer Type and Active status. Only accounts matching your filter rules will sync.

**Subscriptions** Subscription data syncs to the matched customer record. You have full control over which subscriptions are included and what data is pulled from them.

Filter subscriptions by status, version, or date range to sync only the records that matter — for example only active subscriptions, or only the latest version of each contract.

For each customer you can either map fields from a single subscription or aggregate values across multiple subscriptions:

*Single subscription* — map standard fields from one subscription per customer. Useful for straightforward one-contract-per-customer setups.

*Aggregated across multiple subscriptions* — calculate values across all matching subscriptions. Available operations: sum numeric values, find the maximum value, find the minimum value. Common examples: summing ARR across all active subscriptions, finding the longest license length, or identifying the shortest notice period.

***

**Setup**

1. Go to Apps → Younium
2. Authenticate using Client Credentials
3. Select which Legal Entities to sync from
4. Configure Accounts: set sync mode, matching field, filters, and field mapping
5. Configure Subscriptions: set filters, select single or aggregated sync, and map fields
6. Save — the integration runs automatically from this point

***

**Settings reference**

**Sync mode** Controls whether the integration creates new records, updates existing ones, or both. Options: Create only, Update only, Create and Update.

**Matching field** The field used to identify whether a Younium account already exists as a customer in Startdeliver. Common options: HubSpot ID, Company ID, or another unique identifier present in both systems.

**Subscription filters** Narrow which subscriptions are included. Filter by active status, version (latest only), or date range (start or end date falls within a defined period).

**Field mapping — standard fields** Map Younium's standard account and subscription properties to Startdeliver fields. Each mapping row defines a source field in Younium and a destination field in Startdeliver.

**Field mapping — custom fields** Map any custom Younium properties to custom fields in Startdeliver. Requires the corresponding custom field to be created in Startdeliver first.

**Aggregation** When syncing across multiple subscriptions, choose the aggregation method per field: sum, maximum, or minimum. Configure this per field in the subscription mapping.

***

**Troubleshooting**

**A customer or subscription is not showing up as expected**

Check the subscription filter — confirm the subscription matches all filter criteria (active status, latest version flag, date range). A subscription outside the filter window will not sync even if it exists in Younium.

Verify the matching field — confirm the customer identifier (HubSpot ID, Company ID, or whichever field you chose) matches exactly between Younium and Startdeliver. A mismatch means the record won't be found and may be skipped or duplicated depending on your sync mode.

Check effective dates — if using date range filters, confirm the subscription's start or end dates fall within the defined range.

Review sync settings — confirm the sync mode is set to what you expect. If set to Update only and the customer doesn't yet exist in Startdeliver, it won't be created.

Check field mappings — confirm that fields you expect to see populated are mapped under Standard or Custom fields in the configuration.

After making changes, allow one full sync cycle to run before checking results.


# Mixpanel

Startdeliver integrates with Mixpanel to sync product usage events and user data from Mixpanel into customer health tracking and the AI assessment.

**Where to find it:** Apps → Mixpanel **Who can access it:** Admins **Category:** Product analytics

***

#### What it does

The Mixpanel integration pulls product usage events and user data from Mixpanel into Startdeliver. Once connected, Mixpanel events feed directly into product usage health — giving the AI a continuous signal on how your customers are actually using your product without your team having to manually track or import anything.

The integration supports two sync types that can be enabled independently: syncing customers and users from Mixpanel, and syncing usage events from Mixpanel. Most teams enable both.

***

#### What syncs

**Usage events** Mixpanel events sync into Startdeliver as usage data, feeding product usage health per customer. You control which events sync — either all events, or a specific list. These events are matched to products and usage types configured in Settings → Products.

**Customers and users** Mixpanel user profiles can sync into Startdeliver as users on the matched customer record. Matching is done via a Startdeliver user field you define — typically email address.

***

<figure><img src="/files/MPbIZo88dCqeVfx4iMjO" alt=""><figcaption></figcaption></figure>

#### Setup

1. Go to Apps → Mixpanel
2. Enter your **Mixpanel API secret** — found in your Mixpanel project settings under Service Accounts or API Access
3. Configure the settings below
4. Click Save

***

#### Settings

**Do you store your customers' personal data in Europe?** Select Yes if your Mixpanel project stores data in the EU data center. If unsure, select No. This affects which Mixpanel API endpoint the integration uses and must be set correctly for data to flow.

**Are you using a Service Account for authentication?** Select Yes if you are authenticating via a Mixpanel Service Account rather than the legacy API secret. Service Accounts are the recommended authentication method for newer Mixpanel projects.

**Enter which events to sync** Specify which Mixpanel events should be pulled into Startdeliver. Enter event names comma-separated — for example: `Logged In,Created Dashboard,Exported Report`. Leave this field empty to sync all events from your Mixpanel project. Syncing all events is a good starting point — you can narrow it down once you know which events matter for health scoring.

**Do you wish to use a Filter when fetching events?** Enable this to apply a filter expression when fetching events from Mixpanel. Useful for excluding internal test events, bot traffic, or events from specific user segments you don't want included in health calculations.

**Do you want to sync customers and users from Mixpanel?** When enabled, Mixpanel user profiles sync into Startdeliver as users on the matched customer record. Requires the matching field configuration below.

**Do you want to sync events from Mixpanel?** When enabled, Mixpanel events sync into Startdeliver as usage data, feeding product usage health. This is the primary reason most teams connect Mixpanel.

**Startdeliver user field to match users on** Select the Startdeliver user field used to match incoming Mixpanel users to existing Startdeliver user records. Typically email address. This field must exist as a custom field on the user object in Startdeliver and must contain the same value that Mixpanel holds for each user.

**(Optional) Startdeliver user field to override for events** By default, Mixpanel events are matched to users using the same field as the user sync. Enable this if you want to match events on a different field — for example, if user profiles sync via email but your Mixpanel events are tagged with a numeric user ID stored in a separate Startdeliver field. Leave empty to use the same matching field for both users and events.

***

#### How Mixpanel events feed health

Once events are flowing, they need to be connected to products in Startdeliver to affect health scoring. Go to Settings → Products, open a product, and go to the Usage Types tab. Attach the relevant Mixpanel event names as usage types. The product health model then scores each customer based on how frequently those events occur relative to the goals you've configured.

→ [Product usage health](/health-and-metrics/product-usage-health)

***

#### Troubleshooting

**Events not appearing in Startdeliver** Confirm the API secret is correct and matches the project you want to sync from. Check whether you're using a Service Account — if yes, ensure the Service Account toggle is set to Yes. If you've specified event names to sync, confirm the names match exactly as they appear in Mixpanel (case-sensitive). Check the EU data storage setting — if your Mixpanel data is in the EU and this is set to No, the integration will query the wrong endpoint and return no data.

**Users not matching to Startdeliver records** Check the matching field — the value in Mixpanel's user profile for that field must exactly match the value in the corresponding Startdeliver user field. If users exist in Mixpanel but not in Startdeliver, they won't be created unless user sync is enabled. Confirm "Do you want to sync customers and users from Mixpanel?" is set to Yes.

**Events syncing but health not updating** Events must be attached to a product as usage types before they affect health. Go to Settings → Products, open the relevant product, and check the Usage Types tab — confirm the event names are attached. Also check the product's goal type and targets are configured correctly.

**Event matching using a different identifier** If your Mixpanel events use a different user identifier than your user profiles (for example, a numeric ID rather than email), use the optional override field to specify the Startdeliver field that holds the matching value for events specifically.

***

Ready to move on to the next integration or use case?


# API & custom integrations

Startdeliver provides a full REST API, usage event tracking, webhook support, and MCP — everything your technical team needs to connect Startdeliver to your stack.

**Where to find it:** Apps → Developer portal · app.startdeliver.com/dev **Who can access it:** Developers and technical admins

***

**What it is**

Startdeliver provides a fully-featured REST API that covers every core object in the platform. If your tool isn't in the app marketplace, or you need a custom data flow that a native integration doesn't support, the API gives you full programmatic access to build exactly what you need.

The API is also how your product sends usage events to Startdeliver — the raw signals that feed product usage health and the AI assessment. This is one of the most important integrations for any Startdeliver customer, because product usage data is central to how the AI understands and assesses each customer.

***

**What the API covers**

The Startdeliver API supports read and write operations across all core platform objects:

* **Customer** — create, update, and read customer records
* **User** — sync users from your product or CRM
* **Team member** — manage team member records programmatically
* **Project** — create and update projects on customer records
* **Task** — create, assign, and complete tasks
* **Custom field** — read and write custom field values
* **Usage** — send product usage events from your platform
* **Support** — sync support ticket data from custom sources
* **Feedback** — send survey and feedback data from custom sources
* **File** — attach files to customer records
* **Product** — manage product definitions
* **Usage type** — define and manage usage event types
* **Customer status** — read and update lifecycle stage

***

**Usage events — the most important integration**

Usage events are how your product tells Startdeliver what your customers are doing. Every feature interaction, login, or custom event your product tracks can be sent to Startdeliver via the Usage API or the JavaScript library.

Once usage events are flowing, Startdeliver maps them to products and usage types, calculates health per product per customer, and feeds that signal into the AI assessment. This is what makes the health model specific to how your customers actually use your product — not a generic engagement score.

**Two ways to send usage events:**

**JavaScript library** — for web applications. Include the Startdeliver JS library in your front end and send usage events directly from the browser as users interact with your product.

**Usage API** — for server-side event tracking. Send events via HTTP from your backend whenever a usage event occurs.

→ [Full usage event documentation](https://app.startdeliver.com/dev)

***

**Building a custom integration**

If your tool isn't in the Startdeliver app marketplace, you can build a custom connector using the API. Common use cases:

* Syncing customers and users from a proprietary system
* Sending usage data from a product built on a custom analytics stack
* Pulling Startdeliver health data into an internal BI tool or data warehouse
* Pushing customer data from Startdeliver into a custom CRM or ERP

The API uses standard REST conventions with JSON responses. Authentication is via API key. Full reference documentation, guides, and code examples are in the developer portal.

→ [Open developer portal](https://app.startdeliver.com/dev)

***

**Webhooks**

Startdeliver supports webhooks for real-time event handling. Subscribe to events — customer created, health status changed, task completed, and more — and receive a HTTP POST to your endpoint the moment something happens. Useful for keeping external systems in sync without polling.

→ [Webhook documentation](https://app.startdeliver.com/dev)

***

**MCP server**

If you want an AI tool to work directly in Startdeliver, use the MCP server.

Supported tools can read customers, tasks, and projects, then act within granted permissions.

→ [MCP server guide](https://app.startdeliver.com/dev/tutorial/mcp-server) → [MCP - Model Context Protocol](/jecta-agent-and-ai/mcp-model-context-protocol)

***

**Building and publishing apps**

The Startdeliver App Directory lets you build apps that extend the platform for your own use or distribute to other Startdeliver customers. If you've built a connector your customers could benefit from, you can publish it in the marketplace.

→ [App Directory](https://app.startdeliver.com/apps) → [Developer portal](https://app.startdeliver.com/dev)

***

**Getting started**

The fastest path to your first API integration:

1. Go to the [developer portal](https://app.startdeliver.com/dev) and read the overview
2. Generate your API key in Settings → Security
3. Follow the relevant guide — Sync customers and users, Start sending usage, or Check out the API
4. Test with the interactive API reference before building in production


# AI Assessments

Every customer assessed automatically. No manual scoring. No gut feel. Just a current, accurate read on every account — with recommended next steps.

***

<figure><img src="/files/U1psTyJjsF00wDRKjOBw" alt=""><figcaption></figcaption></figure>

### AI Assessments

**Where to find it:** Every customer profile → Assessment panel · Settings → AI **Who can access it:** All team members

***

#### What it is

AI Assessments is the intelligence engine at the core of Startdeliver. It reads all available context for every customer — product usage, experience feedback, support activity, relationship engagement, revenue data, and more — and produces a plain-language assessment of where each customer stands and what your team should do next.

The assessment runs continuously and automatically. It does not need to be triggered. It does not require a CSM to fill in a form. When new data comes in — a survey response, a delayed ticket, a drop in usage, a week of silence — the assessment updates.

***

#### What the assessment produces

On every customer profile, the Assessment panel shows:

**Status** — a plain-language verdict on the customer's current state. Not a number. Not a colour alone. A label that means something: Strongly Thriving, Actively Engaged, Neutral, Needs Attention, At Risk.

**Summary** — one or two sentences describing what is driving the status. What the AI actually found, stated plainly. "Strong engagement with deep adoption, proactive communication, and expansion signals." Or: "Usage declining across core features, last survey response poor, no CSM contact in 6 weeks."

**Trend** — how the assessment has moved over the past weeks and months. Whether things are improving, holding steady, or deteriorating.

**Take Action** — a recommended next step tied specifically to what the AI found for this customer. Not a generic playbook item — a specific, contextual recommendation.

**See full analysis** — the complete breakdown of every signal the AI read, the data behind each one, and the reasoning behind the assessment.

<figure><img src="/files/Lh9ovGCLhctVimZ8liC0" alt=""><figcaption></figcaption></figure>

***

#### What the AI looks for

The AI reads the full picture of the customer relationship. Key signals include:

**Product engagement** — are users active? Is adoption deepening or narrowing? Are the right users using the right features?

**Customer sentiment** — what are survey responses telling you? Is sentiment improving or declining? Are there signals of an advocate or an early warning of churn?

**Support health** — are there open or delayed tickets? Is the customer getting timely help or quietly struggling?

**Relationship activity** — when did your team last meaningfully engage? Is the customer active in Shared Space? Are emails and messages flowing or has communication gone quiet?

**Revenue context** — what is the account worth? When does it renew? Is seat utilisation growing or shrinking?

The AI does not treat these signals as separate scores to average. It reads them together. A customer with strong usage but declining sentiment and a two-month communication gap is a specific situation — the AI identifies the pattern and tells your team what it means.

***

#### Flags the AI raises

Beyond the general assessment, the AI identifies specific patterns worth flagging:

**Churn risk** — a customer showing early warning signs: declining usage, poor feedback, unresolved support issues, or communication that has gone quiet. Surfaced proactively so your team can act before the customer raises it.

**Expansion opportunity** — a customer with strong adoption, positive sentiment, and growing usage who may be ready for an upgrade, an additional product, or a wider rollout.

**Reference and advocate** — a customer with consistently strong feedback across multiple contacts. Worth a conversation about a case study, reference call, or partnership.

**Silent customer** — a customer who has stopped engaging across all channels. Not necessarily churning, but worth attention before the silence becomes a decision.

***

#### You are in control

The assessment is powerful out of the box, but it is designed to work the way your business works — not the other way around.

Through AI instructions in Settings → AI you control:

**Your instructions** — give the AI specific guidance about your business, your customers, and what matters to your CS motion. The AI applies this context to every assessment it runs.

**Team access** — choose which team members can view and use assessments.

**Customer scope** — select which customers get assessed. Useful if you are rolling out AI features progressively or have customer segments that require different treatment.

**Interaction settings** — fine-tune which interactions are included in the context, and create custom interaction types specific to your business.


# AI instructions

Jecta already knows how to do great CS. AI instructions tell it the things about your specific business that it couldn't know otherwise.

**Where to find it:** Settings → AI → Instructions **Who can access it:** Admins

***

**What it is**

Startdeliver's AI model covers the fundamentals of Customer Success out of the box — the most common assessment patterns, health signals, risk indicators, and recommended actions that apply across most CS teams and most customer bases. For the vast majority of your customers, the AI will assess and act correctly without any additional input.

AI instructions cover the remaining edge cases. The things that are specific to your business, your product, your customer segments, and your way of working that the AI couldn't know from the data alone.

Think of it like briefing a highly experienced new CSM. You don't teach them what churn risk looks like or how to run a Business Review — they already know that. You tell them the things unique to your company: which customer segment has unusual behaviour, which product configuration signals something important, which stakeholder change should trigger an immediate response. That's what AI instructions are for.

***

**What to include**

Instructions should cover the specific, the niche, and the contextual. If the AI would handle it correctly without any guidance, don't include it. If it requires knowledge of your specific business to get right, add it.

**Industry or segment-specific exceptions** When a certain type of customer behaves differently from the norm — in how they use your product, what they need from your team, or what signals mean something different for them.

*Example: "Customers in the public sector do not use Product C. Low usage of Product C for these accounts is not a negative signal — do not flag it as a health risk."*

*Example: "Customers in the healthcare segment have a slower onboarding cycle due to compliance requirements. Treat 90-day onboarding as standard for this segment rather than flagging it as delayed."*

**Commercial thresholds that change the CS motion** When ARR, seat count, or contract value changes how your team operates — who gets involved, what level of attention is warranted, what the escalation path looks like.

*Example: "For customers with ARR above 3M, there is a dedicated support person assigned. Always reference this in the context of support health — delayed tickets for these accounts should be escalated immediately, not treated the same as standard accounts."*

*Example: "Customers on our Enterprise contract include professional services hours. If a customer hasn't used their PS hours 60 days before renewal, flag this as a risk and create a task for the CSM."*

**Stakeholder changes that matter disproportionately** When a specific type of user change on the customer side has an outsized impact on the relationship — a key role changing hands, a champion leaving, a new executive arriving.

*Example: "A change in user type for a Super Admin is high priority. This often signals an internal restructure or a change in ownership of the product. Always flag this immediately and create a task for the assigned CSM regardless of current health status."*

*Example: "When the primary billing contact changes, notify the CSM and create a follow-up task. This sometimes precedes a contract renegotiation."*

**Product-specific signals** When usage of a specific feature or product tells you something important about the customer's trajectory — positive or negative — that the standard health model wouldn't surface on its own.

*Example: "Activation of the API integration is a strong positive signal — customers who integrate via API have 40% higher retention rates. When this happens, flag it as an expansion signal and suggest the CSM schedule a technical deep-dive."*

*Example: "Customers who have never activated the reporting module are at higher churn risk at renewal. Flag this as a risk if it's still inactive 90 days before renewal."*

**Your terminology and naming** If your internal language differs from standard CS terminology, or if you use specific names for products, tiers, or lifecycle stages that the AI should recognize and use correctly.

*Example: "We refer to our top-tier customers as Platinum accounts, not Enterprise. When referencing these accounts in assessments and actions, use 'Platinum' not 'Enterprise'."*

***

**What not to include**

Don't replicate what the AI already handles well. Instructions about general churn risk, onboarding best practice, how to run a Business Review, or what good adoption looks like are already part of the AI's model. Adding them to your instructions won't improve the output and makes the instructions harder to maintain.

The test: if this instruction would apply equally to any CS team using any SaaS product, you probably don't need it. If it's specific to your business, your customers, or your product, add it.

***

**How instructions are applied**

Instructions apply globally across your entire workspace — to every customer assessment, every Jecta action, and every AI-generated recommendation. They run on top of the standard model, adding your specific context to every decision the AI makes.

The AI reads your instructions alongside all the customer data it has access to. When a situation matches one of your instructions, that instruction takes precedence over the default model behaviour. Everything else continues to run as normal.

***

**Version history and change tracking**

Every change to your AI instructions is tracked and versioned. When you save an update, the previous version is preserved — you can see exactly what changed, when it changed, and who changed it.

This matters because AI instructions apply globally. A single change affects how the AI assesses and acts across your entire customer base. Version history gives you a safety net — if an instruction change produces unexpected results in assessments or Jecta actions, you can see precisely what changed and restore a previous version.

Before making significant changes to your instructions, it's worth reviewing a few customer assessments first so you have a baseline. After saving, check the same customers again to see how the change affected the output. If something looks wrong, version history lets you identify and reverse the specific change quickly.

***

**Access and permissions**

AI instructions are restricted to admins only. Only team members with Admin access can view, edit, or save instructions.

This is intentional. Because instructions apply globally and affect every AI assessment and Jecta action across the workspace, changes should be deliberate and controlled. If you need to update instructions based on input from your CS team, an admin should make the change — not individual CSMs.

If you need to request a change to AI instructions, contact your Startdeliver admin.

***

**Tips for writing good instructions**

**Be specific and concrete** Vague instructions produce vague results. "Public sector customers are different" tells the AI nothing. "Public sector customers do not use Product C — low usage is not a risk signal for this segment" tells it exactly what to do.

**Use if/then framing where helpful** Instructions written as conditions are easiest for the AI to apply consistently. "When X happens, do Y" or "If a customer is in segment Z, treat this signal differently."

**Keep it focused** A few precise instructions outperform a long document of general guidance. Prioritize the situations that come up regularly and have the highest impact when the AI gets them wrong.

**Review periodically** As your business evolves — new products, new segments, new commercial thresholds — your instructions should evolve too. A quarterly review keeps them accurate.

**Test after updating** After adding an instruction, open a customer it applies to and check whether the assessment and recommended actions reflect the new context correctly. If not, refine the wording.

***

**Where to go next**

→ [AI Assessments](/jecta-agent-and-ai/ai-assessments) — how the AI assesses customers\
→ [AI data & context](/jecta-agent-and-ai/ai-data-and-context) — what signals the AI reads\
→ [Jecta: AI Agent](/jecta-agent-and-ai/jecta-ai-agent) — how Jecta acts on assessments and instructions


# Jecta: AI Agent

The CS agent that works while your team sleeps.

### Jecta: AI Agent

**Where to find it:** Your Startdeliver account · jecta.ai **Who can access it:** Available as part of Startdeliver. See your plan for details.

***

#### What Jecta is

Jecta is an autonomous CS agent that runs on top of your Startdeliver platform. It reads the same customer context and AI assessments your team sees — and then acts on them, proactively, without waiting for a CSM to pick up the task.

Where Startdeliver gives your team the tools and intelligence to do great CS, Jecta handles the work that would otherwise fall through the cracks. The at-risk customer who needed a touchpoint last Tuesday. The expansion signal that sat in the assessment panel for two weeks before anyone actioned it. The onboarding task that was waiting on a customer response that never came.

Jecta does not replace your CS team. It extends what they can do — handling the high-volume, time-sensitive, routine work so your CSMs can focus on the relationships and conversations that genuinely need a human.

***

#### What Jecta does

**Proactive outreach** Jecta identifies customers who need a touchpoint — based on the AI assessment, usage signals, support status, or time since last contact — and reaches out on your team's behalf. The message is personalised to the customer's context. The timing is based on what the data says, not what the CSM's calendar allows.

**Risk intervention** When a customer shows early churn signals, Jecta acts before the situation escalates. It does not wait for a CSM to notice and find time. It reaches out, surfaces the concern, and works to re-engage the customer while the relationship is still recoverable.

**Expansion and advocacy activation** Jecta identifies customers who are ready for an upgrade or deep enough in the relationship to be an advocate — and initiates those conversations at the right moment.

**Shared Space management** Jecta manages and updates Shared Space on behalf of your team — keeping customer-facing content current, responding to activity, and ensuring the collaboration layer stays alive between CSM touchpoints.

**Routine CS tasks** Check-ins, follow-ups, task reminders, status updates — the high-volume work that every CS team knows needs doing and rarely has time for consistently. Jecta handles this at scale.

***

#### How Jecta works

Jecta operates on the same data and context as the rest of Startdeliver. Every action it takes is grounded in the customer's actual situation — not a generic template. It knows the customer's health status, their recent usage, their open support tickets, when your team last contacted them, and what the AI assessment says about where they stand.

Actions taken by Jecta are visible in the customer timeline, so your team always knows what has been sent or done. CSMs can review, adjust, or take over at any point. Jecta operates with autonomy, but your team stays informed.

***

#### Status

Jecta is in early access and rolling out to customers now. If you are interested in joining the early access programme, speak to your Startdeliver CSM or visit jecta.ai.


# AI data & context


# AI Manager


# MCP - Model Context Protocol

Connect AI agents and tools directly to your Startdeliver data using the Model Context Protocol.

**Where to find it:** Settings → MCP **Who can access it:** All users. Admins control available permissions and scopes.

***

### Connecting AI tools via MCP

Startdeliver exposes an MCP server that lets AI tools and assistants connect to your customer data.

### What it does

Once connected, an AI tool can read customers, tasks, and projects, and take actions within the permissions you grant.

MCP works with AI tools and assistants that support MCP or custom connectors.

Claude, Claude Code, and ChatGPT are common examples.

***

### Permissions

Authentication uses standard OAuth.

Admins control which scopes are available — users can only grant what admins have permitted.

***

### How to connect

#### Option 1 — Connect by URL

Use this when your AI tool supports OAuth sign-in flows.

1. Copy the MCP server URL: `https://mcp.startdeliver.com/mcp`
2. Add it as a custom connector in your AI tool
3. On first connection, you will be prompted to authenticate via OAuth and approve permissions

In Claude, adding a custom connector is limited to admins or organization owners.

→ [Full setup guide](https://app.startdeliver.com/dev/tutorial/mcp-server)

***

#### Option 2 — Bearer Token

Use this when your AI tool does not support OAuth.

1. Go to **Settings → MCP**
2. Generate an API key and select the permissions it should have
3. Paste the key directly into your AI tool

→ [Full setup guide](https://app.startdeliver.com/dev/tutorial/mcp-server)

***

### Troubleshooting

#### Connection not working

Check that the OAuth scopes you need are enabled by your admin. Users cannot grant permissions that admins have not permitted.

#### AI not seeing customer data

Verify that the correct read scopes were approved during the OAuth consent step. If unsure, disconnect and reconnect to go through the consent screen again.


# Use case: Churn Prevention

The customers most likely to churn rarely announce it. They go quiet.

**The situation**

By the time a customer tells you they're leaving, the decision is usually already made. The conversation you're having isn't a negotiation — it's a formality. The real churn event happened weeks or months earlier, when something shifted and nobody noticed.

Maybe usage started dropping. Maybe a key champion left and the replacement never got properly onboarded. Maybe a support ticket sat unresolved long enough that the customer quietly lost confidence. Maybe your team just hadn't been in contact for two months because the account looked fine on paper.

Churn prevention isn't about rescue conversations. It's about catching the signals early enough that you still have time to do something about them.

***

**The approach**

Most CS teams think about churn reactively — they respond when a customer raises a concern, or when a renewal comes up and the conversation feels wrong. That's retention, not prevention. Prevention requires a different posture entirely.

The shift is from managing accounts to reading accounts. Every customer is constantly sending signals about how the relationship is going — through how they use your product, what they say in surveys, how quickly their support tickets get resolved, and whether your team is actually in regular contact with the people who matter. The question isn't whether the signals are there. It's whether your team has the capacity and the visibility to read them.

The second shift is from treating all at-risk accounts the same to prioritizing by impact. A 5,000 ARR customer with declining usage and a 200,000 ARR customer with declining usage are not the same problem. Your response — and how fast you move — should reflect that.

The third shift is from CSM intuition to systematic signals. Intuition matters, but it doesn't scale. When one CSM owns 80 accounts, they can't rely on gut feel to know which three need attention this week. The signal has to surface automatically.

***

**How to do it in Startdeliver**

**Let the AI identify at-risk accounts automatically**

<figure><img src="/files/hK3FqmseZceANipOrjIv" alt=""><figcaption></figcaption></figure>

Startdeliver reads all available signals for every customer continuously — product usage, survey responses, support ticket status, how recently your team has been in contact, and whether the customer is on track toward their goals. When a pattern emerges that indicates risk — declining usage, poor feedback, an overdue support ticket, two months of silence — the AI flags it without your team having to manually review every account.

Every at-risk customer gets a plain-language assessment: what the AI found, why it matters, and what to do next.

→ [How health assessment works](/health-and-metrics/how-to-set-up-health-metrics-and-assessment)

**Build an At Risk list**

Create a saved list in the Customers view filtered to customers the AI has flagged as Needs Attention or At Risk. Sort by ARR. This is your team's churn prevention dashboard — the accounts that need human attention, ranked by what's at stake.

<figure><img src="/files/iFMAMxH3RKZKmx7cdM1L" alt=""><figcaption></figcaption></figure>

Review this list in your team meeting. Assign ownership. Set a follow-up date.

→ [Lists & filters](/platform-settings/lists-and-filters)

**Act on the recommended action**

The AI doesn't just flag the problem — it tells you what to do. For at-risk accounts the recommended action is typically a direct outreach, a call, or a specific task to resolve the underlying issue. Use the Take Action button on the customer profile to log what you're doing and track it to completion.

<figure><img src="/files/RheuvfTNMPz0KDSH4rNF" alt=""><figcaption></figcaption></figure>

For accounts where the risk is low engagement or communication silence, send a message. For accounts where the risk is a specific support issue, resolve it and follow up personally. For accounts where the risk is goal misalignment, schedule a Business Review.

**Set up automated early warning**

Configure automations that trigger when risk signals appear — for example, when a customer's usage health drops to Poor for two consecutive weeks, automatically create a task for the assigned CSM and notify them via email. This means at-risk signals never sit unactioned because a CSM was busy or the account wasn't top of mind.

→ [Automations](/managing-customers/automations)

**Let Jecta handle the early touchpoints**

For large portfolios, Jecta can reach out to at-risk customers proactively — before the CSM even sees the flag. A timely, personalized message sent at the right moment can re-engage a drifting customer before the relationship deteriorates further.

→ [Jecta: AI Agent](/jecta-agent-and-ai/jecta-ai-agent)

**Track goals to catch misalignment early**

A customer who is using your product but not achieving their business goals is a churn risk even if usage looks healthy. If you've set Customer Goals for the account, the AI reads goal progress as part of the assessment. A customer falling behind on their stated outcome — growing sales, reducing cost, saving time — is a risk that usage data alone won't surface.

→ [Customer Goals & Success Plans](/managing-customers/customer-goals-and-success-plans)

***

**What good looks like**

* Your team starts the week knowing exactly which accounts are at risk and why — without manually reviewing every customer
* At-risk accounts are sorted by ARR so the highest-value risks get attention first
* No customer goes more than a defined number of days without contact before a task is automatically created
* CSMs are having proactive conversations — not reactive ones — because they heard from Jecta or the AI before the customer got close to a decision
* Churn happens, but it's rarely a surprise. When it does happen, you know why — and you can see whether the signal was there earlier and what would have changed the outcome


# Use case: Onboarding Automation

Getting a customer set up is easy. Getting them to their first success is the actual job.

**The situation**

Most onboarding programs are built around the vendor's process, not the customer's outcome. There's a kickoff call, a series of setup tasks, a training session, and then a handoff to the CSM. The customer is technically onboarded. But are they successful?

The distinction matters enormously. A customer who completes onboarding but never reaches their first meaningful outcome — the moment where they can clearly see that your product is working for them — is already on the path to churn. They've invested time and effort. They've set up the tool. And nothing has noticeably changed in their business yet. The clock is ticking.

The other failure mode is inconsistency. When every CSM runs onboarding differently, some customers get a great experience and some don't. The quality of your onboarding shouldn't depend on which CSM a customer is assigned to.

***

**The approach**

Good onboarding has a clear destination — the customer's first success — and everything in the onboarding program is designed to get them there as quickly as possible.

This means the onboarding plan starts with a question: what does success look like for this customer at 30, 60, and 90 days? Not generic platform milestones. The specific outcome this customer is trying to achieve with your product. A CRM company's customer might define success as their sales team running their full pipeline in the tool within 30 days. An HR company's customer might define success as their first hire closed entirely through the platform within 60 days. The onboarding plan is then built backward from that outcome.

The second principle is shared accountability. Onboarding fails most often not because the vendor doesn't deliver, but because the customer doesn't complete their part of it. When the plan is only visible to your team, the customer has no visibility into what's expected of them and when. Shared visibility changes the dynamic — both sides can see what's done, what's pending, and what's at risk of slipping.

The third principle is standardization with flexibility. You need a consistent structure so every customer gets a great experience, but you need enough flexibility to adapt to each customer's specific situation. Templates give you the structure. Shared Space gives you the collaboration layer. Goals give you the outcome anchor.

***

**How to do it in Startdeliver**

**Build a standardized onboarding template**

Create a project template for onboarding that contains every task your team and the customer need to complete — with snooze days so each task appears at the right moment rather than all at once. The template should reflect the fastest path to the customer's first success, not an exhaustive list of everything that could be configured.

<figure><img src="/files/wpPmYWx0MhBxhLgvInam" alt=""><figcaption></figcaption></figure>

Define what "onboarding complete" means. Either the final task triggers project completion automatically, or completion is marked manually at the kickoff of the adoption phase.

<figure><img src="/files/W0VKfsgQVS5lKo43vTeu" alt=""><figcaption></figcaption></figure>

→ [Templates & projects](/platform-settings/templates-and-projects)

**Set an onboarding goal**

Create a Customer Goal for the onboarding period — the specific business or adoption outcome this customer is trying to reach. Link it to the onboarding project and the key tasks within it. This keeps the team and the customer oriented toward the outcome, not just the task list.

<figure><img src="/files/SPRKBFVAglPbf9uG3j4k" alt=""><figcaption></figcaption></figure>

→ [Customer Goals & Success Plans](/managing-customers/customer-goals-and-success-plans)

**Launch Shared Space from day one**

From the moment the onboarding project is created, invite the customer's key stakeholders to Shared Space. They can see the full onboarding plan, their assigned tasks, progress toward the goal, and any files or resources your team shares. They can comment, ask questions, and mark their tasks done — without needing to email their CSM for a status update.

Shared Space changes the onboarding dynamic. The customer is a participant, not a recipient.

→ [Setting up Shared Space](/managing-customers/shared-space)

**Track adoption in real time**

As the customer's users start engaging with your product, product usage health updates automatically. Your CSM can see on day 15 whether users are activating at the rate needed to hit the 30-day goal — and intervene early if adoption is behind rather than waiting until the goal is missed.

→ [Product usage health](/health-and-metrics/product-usage-health)

**Automate the routine touchpoints**

Configure automations to handle the things that happen on every onboarding — a welcome message when the project launches, a check-in task at day 14, a celebration message when the first milestone is hit, a flag to the CSM if a task goes overdue. These touchpoints don't need to come from the CSM every time. They need to happen consistently.

→ [Automations](/managing-customers/automations)

**Chain onboarding into adoption automatically**

When onboarding completes, automatically launch the next project — the adoption phase, the first Business Review, or whatever comes next in your customer journey. The customer moves from one phase to the next without a gap, and your CSM gets a task prompting them to review the onboarding outcomes before the next conversation.

<figure><img src="/files/xOTdvOh2Yb8QeOqDL10Z" alt=""><figcaption></figcaption></figure>

→ [Templates & projects](/platform-settings/templates-and-projects)

**Scale with Jecta**

For large onboarding volumes — or for customer segments where a high-touch CSM isn't commercially viable — Jecta manages the onboarding motion autonomously. It monitors task completion, sends reminders to customers who haven't completed their steps, updates Shared Space, and escalates to a human CSM when something genuinely needs attention.

→ [Jecta: AI Agent](/jecta-agent-and-ai/jecta-ai-agent)

***

**What good looks like**

* Every customer follows the same onboarding structure regardless of which CSM they're assigned to — but the goal and the content reflect their specific outcome
* Customers can see their onboarding progress, their tasks, and their goal without asking their CSM for an update
* Your team knows on day 14 whether a customer is on track to hit their 30-day goal — and acts on that information rather than finding out at day 31
* Onboarding completion triggers the next phase automatically — no customer falls into a gap between onboarding and adoption
* Onboarding at scale doesn't require proportionally more CSMs — templates, automation, and Jecta handle the volume so your team focuses on the customers who genuinely need them


# Use case: Success Plan

A Success Plan is not a document. It's a shared commitment between you and your customer about what success looks like and how you're going to get there together.

**The situation**

Most CS teams have some version of a Success Plan. A template in a spreadsheet. A slide deck updated before the quarterly Business Review. A shared folder with a roadmap and some milestones. The intent is right — define the goal, track the progress, show the value.

The problem is that these plans almost always live in your tool, not the customer's. The customer sees it once at the start of the engagement, maybe again at the Business Review, and rarely in between. In practice, the Success Plan becomes an internal document your team maintains to prove they're doing their job — rather than a living commitment that guides the relationship on both sides.

When the plan isn't truly shared, accountability slips. Your team is managing toward milestones the customer has forgotten. The customer feels like things are happening to them, not with them. And when renewal comes around, you're trying to reconstruct the value story rather than simply pointing to a shared record of what was achieved.

***

**The approach**

A real Success Plan has three qualities that most plans lack.

The first is a genuine business outcome at the top. Not a list of features to activate or training sessions to complete — the actual result your customer is trying to achieve for their own business. If you sell HR software, the outcome might be reducing cost-per-hire by 25%. If you sell a project management tool, it might be getting three departments fully adopted within six months. The plan exists to get the customer to that outcome. Everything else — the tasks, the milestones, the adoption goals — serves that north star.

The second is shared visibility. The customer sees the plan, tracks progress against it, and owns their part of it. This changes the dynamic from vendor-managed to partnership. When a customer can see that their onboarding tasks are overdue, they often complete them without being chased. When they can see that their usage goal is behind, they ask what they can do to accelerate. Visibility creates accountability on both sides.

The third is continuous connection to reality. A plan that was set at kickoff and never updated against actual data is just a wish list. A real Success Plan reflects what's actually happening — adoption data, survey results, task progress, support health — and updates as the relationship evolves. The AI reads all of this and keeps your team honest about whether the plan is on track.

***

**How to do it in Startdeliver**

**Start with the business outcome**

Before creating a project or a task, create a Customer Goal that reflects what this customer is trying to achieve. Name it in their terms — their outcome, not your product feature. "Grow sales pipeline by 50% in 12 months" not "CRM adoption." This goal becomes the anchor for everything that follows.

<figure><img src="/files/SPRKBFVAglPbf9uG3j4k" alt=""><figcaption></figcaption></figure>

→ [Customer Goals & Success Plans](/managing-customers/customer-goals-and-success-plans)

**Build the Success Plan as a shared project**

Create a project from your Success Plan template. Include the key milestones, tasks for both your team and the customer, and any documents or resources relevant to the engagement. Set the project to Shared so it appears in the customer's Shared Space from the moment it launches.

<figure><img src="/files/VDj5UURdWzEsyJCQvogQ" alt=""><figcaption></figcaption></figure>

Link the project to the Customer Goal so progress on tasks and milestones contributes directly to goal tracking.

→ [Projects](/managing-customers/projects) · [Templates & projects](/platform-settings/templates-and-projects)

**Launch Shared Space**

Invite the key stakeholders from the customer side — the decision maker, the champion, the operational lead — to Shared Space. They log in, see the plan, see their tasks, see the goal and the current progress toward it. They can comment, ask questions, and complete their assigned steps without emailing their CSM.

When the customer is actively engaged in Shared Space, it's a signal the partnership is healthy. When they've gone quiet, it's a signal worth investigating.

→ [Setting up Shared Space](/managing-customers/shared-space)

**Let the AI read the plan**

Once the goal is set and the project is running, the AI reads them as part of the customer assessment. If tasks are slipping and adoption is behind goal, the AI surfaces this as an at-risk signal before the customer brings it up. If usage is strong and the customer is ahead of schedule, the AI identifies this as an expansion or advocacy signal.

<figure><img src="/files/U1psTyJjsF00wDRKjOBw" alt=""><figcaption></figcaption></figure>

The Success Plan isn't just a communication tool — it's a data source the AI uses to understand trajectory.

→ [How health assessment works](/health-and-metrics/how-to-set-up-health-metrics-and-assessment) · [AI Assessments](/jecta-agent-and-ai/ai-assessments)

**Use the Business Review as a checkpoint, not a presentation**

When the Business Review arrives, you're not building a story from scratch. You open Shared Space with the customer and walk through what was committed, what was delivered, and what's next. The plan, the progress, and the data are all there — visible to both sides, updated in real time.

The Business Review becomes a conversation about the future rather than a defense of the past.

**Automate the rhythm**

Configure automations to keep the Success Plan moving without manual effort — a check-in task for the CSM at 30-day intervals, a message to the customer when a milestone is reached, a flag when a task has been overdue for more than a week. The rhythm of the plan runs automatically. The CSM focuses on the conversations that matter.

→ [Automations](/managing-customers/automations)

***

**What good looks like**

* Every customer has a named business outcome that your team and the customer agreed on at the start of the engagement — and that the AI reads as part of every health assessment
* Customers log into Shared Space regularly — not because they're chased, but because their plan is there and it's useful to them
* Your CSMs walk into Business Reviews with a shared record of what was committed and what was achieved — not a slide deck they built the night before
* The AI tells your team when a Success Plan is at risk before the customer does — giving you time to intervene rather than react
* Renewal conversations start with "here's what we achieved together" rather than "let me remind you of the value we provide"


# Use case: Driving Expansion

The best time to expand a customer is when they're already succeeding. The worst time is when you need the revenue.

**The situation**

Most expansion motions are driven by the wrong trigger. A renewal is coming up, so the account executive reaches out about an upsell. The CS team hits a revenue target deadline, so they push add-ons to whoever seems receptive. The expansion conversation happens because someone on your side needs it to happen — not because the customer is ready for it.

Customers feel this. An expansion conversation that arrives before the customer has achieved meaningful value from what they already have feels like a sales call. It erodes trust. And it almost always fails.

The teams that consistently grow revenue from their existing customer base do something different. They watch for the signals that tell them a customer is ready — deep adoption, goals being hit, stakeholders who are vocal advocates — and they start the expansion conversation at exactly that moment. Not because the calendar says so. Because the customer's own data says so.

Expansion that comes from customer success is the easiest sale you'll ever make. Expansion that comes from revenue pressure is the hardest.

***

**The approach**

Expansion readiness has a pattern. It shows up in the data before it shows up in a conversation.

A customer who has adopted your core product deeply — high user activation, consistent usage, features being used in sophisticated ways — has extracted value and has headroom to do more. A customer who has hit their business goal ahead of schedule is already in the mindset of what comes next. A customer with multiple stakeholders who are actively engaged and vocal about their results is one conversation away from becoming a reference and a candidate for a broader rollout.

The problem is that most CS teams can't see this pattern across their full portfolio. They know their top accounts because they talk to them regularly. But the expansion signal in account 47 of 80 doesn't surface unless someone goes looking for it.

The shift is from account-by-account intuition to portfolio-wide signal detection. The AI reads every customer, continuously, and identifies the ones showing expansion patterns — so your team can act on them at the right moment rather than missing the window.

The second shift is from expansion as a sales motion to expansion as a CS motion. The CSM who has built the relationship, tracked the goals, and demonstrated the value is the right person to have the expansion conversation — not an account executive who re-enters the relationship at renewal. When CS owns expansion, the conversion rate goes up and the customer experience improves.

***

**How to do it in Startdeliver**

**Let the AI identify expansion signals**

Startdeliver reads every customer continuously and flags expansion opportunities automatically. The signals it looks for include: deep and growing product adoption, business goals being hit ahead of schedule, strong and consistent experience health, high stakeholder engagement in Shared Space, and usage patterns that suggest the customer has outgrown their current tier or configuration.

When the AI identifies an expansion signal, it surfaces a recommended action — not a generic "consider upsell" note, but a specific suggestion grounded in what the data shows about this customer's situation.

<figure><img src="/files/U1psTyJjsF00wDRKjOBw" alt=""><figcaption></figcaption></figure>

→ [How health assessment works](/health-and-metrics/how-to-set-up-health-metrics-and-assessment) · [AI Assessments](/jecta-agent-and-ai/ai-assessments)

**Build an Expansions list**

Create a saved list in the Customers view filtered to customers the AI has flagged as expansion opportunities. Sort by ARR — the largest accounts with expansion potential deserve attention first. Review this list regularly and assign CSMs to initiate the conversations.

<figure><img src="/files/XZvWGBmUkeKyBiWXsEBT" alt=""><figcaption></figcaption></figure>

→ [Lists & filters](/platform-settings/lists-and-filters)

**Track goal achievement as the expansion trigger**

When a customer hits their business goal — or is clearly tracking ahead of schedule — that's the moment to introduce what comes next. The Customer Goals view in Ongoing shows you which customers have completed goals or are close to completion across the full portfolio. This is your expansion pipeline, grounded in customer outcomes rather than revenue targets.

<figure><img src="/files/WOJ28UCg8OYpyo9OSbL1" alt=""><figcaption></figcaption></figure>

→ [Customer Goals & Success Plans](/managing-customers/customer-goals-and-success-plans) · [Ongoing — Your actions](/managing-customers/ongoing-your-actions)

**Use Shared Space to plant the seed**

The Business Review is the natural moment for the expansion conversation — but Shared Space sets it up. When a customer can see in their own portal that their goal has been achieved, their usage is strong, and their team is getting value, the expansion conversation feels like a natural next step rather than a sales pitch.

Add a Goals section to Shared Space that shows progress toward the original business outcome. When the customer sees they've hit it, ask what they want to achieve next.

→ [Customer Goals & Success Plans](/managing-customers/customer-goals-and-success-plans) · [Setting up Shared Space](/managing-customers/shared-space)

**Identify advocates alongside expansion**

A customer showing expansion signals is also likely showing advocate signals — strong feedback scores, engaged stakeholders, vocal about their results. The AI flags both simultaneously. Before the expansion conversation, a reference call or a case study conversation builds the relationship further and makes the expansion ask feel like a continuation of the partnership rather than a transaction.

<figure><img src="/files/tLVrP3ctPn90BJnkQ7Cj" alt=""><figcaption></figcaption></figure>

→ [Experience health](/health-and-metrics/experience-health)

**Let Jecta handle the signal, your CSM handle the conversation**

Jecta identifies the expansion opportunity and initiates the first touchpoint — a message acknowledging the customer's progress and opening the door to a conversation about what's next. The CSM picks up from there. This means expansion signals get acted on immediately rather than sitting in a list until a CSM finds time.

→ [Jecta: AI Agent](/jecta-agent-and-ai/ai-assessments)

***

**What good looks like**

* Your team knows which customers are ready for expansion before the renewal conversation — because the AI surfaced the signal weeks or months earlier
* Expansion conversations are initiated at the moment of customer success, not at the moment of revenue need
* CSMs own the expansion motion — they have the relationship, the data, and the context to make it feel like a natural next step
* Every customer who hits their business goal has a follow-up conversation about what they want to achieve next — and that conversation happens automatically, not only when a CSM remembers to initiate it
* Expansion revenue is visible at the portfolio level — your Head of CS can see which accounts are ripe and which CSMs are converting


# Use case: Retention Management

Retention isn't managed one customer at a time. It's managed at the portfolio level — with systems, not heroics.

**The situation**

Every CS team retains customers. The question is how. For most teams, retention is a combination of relationship management, reactive firefighting, and the personal judgment of individual CSMs. Some CSMs are exceptional at this. They know their accounts, they read the signals, they act early. Others miss things — not because they don't care, but because they're managing 60, 80, or 100 accounts and the signals that matter are buried in the noise.

The result is retention that's inconsistent, unpredictable, and heavily dependent on who owns the account. Your best CSM retains 95% of their portfolio. Your most stretched CSM retains 75%. And your business can't tell the difference until renewal season arrives.

The other problem is that reactive retention is expensive. A customer who has already decided to leave requires significant time, executive involvement, and often commercial concessions to save — if they can be saved at all. Every hour spent on a rescue conversation is an hour that could have been spent on three early interventions that prevented the problem in the first place.

Retention management at scale requires a system. Not a process that lives in a spreadsheet. Not a weekly meeting where CSMs talk through their riskiest accounts from memory. A live, continuous view of the portfolio that surfaces what needs attention, prioritizes by what's at stake, and ensures nothing slips through.

***

**The approach**

The role of CS is to manage and grow the customer base. That is the goal of the function. But here's what experienced CS leaders understand: you achieve that goal by not focusing on it directly.

Revenue follows customer health. A CS team that obsessively tracks renewals and expansion targets tends to push too hard, too early, on customers who aren't ready — and misses the early warning signals in accounts they thought were fine. A CS team that obsessively focuses on customer health — whether customers are achieving their desired outcomes, whether they're genuinely getting value, whether the relationship is alive and progressing — generates the retention and expansion as a consequence.

This means CS needs to own the revenue number but focus on the health signals. The renewal date matters. The ARR at stake matters. But they're context for prioritization, not the primary object of attention. The primary object of attention is always: is this customer succeeding? If yes, the revenue follows. If no, fix that first.

In practice, this means running your portfolio with both dimensions visible simultaneously — health and revenue — and using them together to decide where to focus.

The other principles are: continuous visibility over periodic reviews, systematic touchpoints over heroic ones, and early signals over late conversations. Retention is won in month 3 and month 6 — not at renewal.

***

**How to do it in Startdeliver**

**Build a retention view that combines health and revenue**

Create a saved list with health status, AI assessment, ARR, and renewal date all visible as columns. Sort by ARR. Now you have the two dimensions you need — health and revenue — in a single view, and you can prioritize based on both simultaneously.

A high-ARR customer with At Risk health gets immediate attention. A low-ARR customer with Neutral health gets a scheduled check-in. A high-ARR customer with Strong health and a renewal in 30 days gets a proactive value conversation. The list makes these priorities obvious without anyone having to figure them out manually.

<figure><img src="/files/jmQrLu8MVjwQJKYraJ40" alt=""><figcaption></figcaption></figure>

→ [Lists & filters](/platform-settings/lists-and-filters) · [MRR & ARR](/health-and-metrics/mrr-and-arr)

**Get early warning notifications before risk becomes churn**

Startdeliver sends heads-up notifications when early risk signals arrive — before the situation becomes a problem. A drop in usage. A poor survey response. A support ticket going overdue. A customer who hasn't been contacted in 30 days. These signals surface automatically as notifications to the assigned CSM, so the team is acting on early signals rather than waiting for the customer to raise a concern.

<figure><img src="/files/TFxXW4rn9M5qOSa7qZfw" alt=""><figcaption></figcaption></figure>

The difference between an early signal and a late one is often the difference between a conversation that saves the account and one that just slows the exit.

→ [How health assessment works](/health-and-metrics/how-to-set-up-health-metrics-and-assessment) · [AI Assessments](broken://pages/uM5YXSGMrvjPefKRa5L0)

**Let the AI do the continuous monitoring**

The AI reads every customer continuously — usage, feedback, support, relationship activity, goal progress — and updates the health assessment automatically. Your team doesn't need to manually review 80 accounts every week to know what's changed. The AI surfaces what matters.

<figure><img src="/files/vSIAiN1XUjaANKsqgDn1" alt=""><figcaption></figcaption></figure>

When a customer drops from Actively Engaged to Needs Attention, the AI flags it. When a combination of signals suggests churn risk — declining usage, poor feedback, overdue support ticket, no CSM contact in 45 days — the AI reads the pattern and raises it.

→ [How health assessment works](/health-and-metrics/how-to-set-up-health-metrics-and-assessment)

**Automate the retention rhythm**

Configure automations that create touchpoints at the moments that matter — not based on a calendar, but based on what's happening in the account. When usage drops below a threshold, create a task for the CSM. When a customer hasn't been contacted in 30 days, send an automatic check-in. When a renewal is 60 days out and health is anything less than Good, alert the CSM and their manager.

The retention rhythm runs automatically. Your team focuses their attention on the accounts where human judgment adds the most value.

→ [Automations](/managing-customers/automations)

**Track renewal pressure in context**

Create a Renewals list filtered to customers renewing in the next 90 days, with health status and ARR visible. A customer renewing in 45 days with Good health across all signals is a very different situation from one renewing in 45 days with Poor experience health and no recent contact. Seeing both together — renewal timeline and health status — is what allows your team to have the right conversation at the right time rather than treating all renewals the same.

<figure><img src="/files/ImNPuRedDd1gNQ4LvZly" alt=""><figcaption></figcaption></figure>

→ [Lists & filters](/platform-settings/lists-and-filters) · [Customer overview](/managing-customers/customer-overview)

**Give managers portfolio visibility**

The individual CSM manages their accounts. The Head of CS manages the portfolio. Use Impact dashboards to give leadership a portfolio-wide view of retention health — NRR trend, churn by segment, health distribution across the team, renewal pipeline. This is the data that turns CS from a cost center into a revenue function.

<figure><img src="/files/1WHF30aSH0UUc18UaOrV" alt=""><figcaption></figcaption></figure>

<figure><img src="/files/UM8Yun7WXK0exTJRN9yT" alt=""><figcaption></figcaption></figure>

→ [Dashboards & Reports](/dashboards-and-reports/impact-dashboard-templates) · [MRR & ARR](/health-and-metrics/mrr-and-arr)

**Use Jecta for high-volume portfolios**

When CSMs are managing large account volumes, Jecta handles the consistent touchpoints — check-ins, usage nudges, renewal acknowledgments — so no account goes dark. The CSM focuses on the accounts that need genuine human attention. Jecta handles the ones that need a timely, personalized message.

→ [Jecta: AI Agent](/jecta-agent-and-ai/ai-assessments)

***

**What good looks like**

* Your team sees health and revenue together in every list view — so prioritization decisions are obvious rather than requiring judgment calls from memory
* Early warning notifications arrive before risk becomes churn — your CSMs are acting on signals, not responding to customer announcements
* Every customer has a current health status at all times — updated automatically as new data arrives, not reviewed manually once a quarter
* Retention touchpoints happen on a consistent rhythm for every customer regardless of who owns the account or how stretched they are
* Your Head of CS can see NRR trend, health distribution, and renewal pipeline in a single view — and can show the board that CS activity drives revenue outcomes, not just satisfaction scores
* Renewal conversations start from a position of demonstrated customer health and value — not a scramble to justify the contract


# Use case: Automated CSM

The best CSMs don't succeed because they work harder than everyone else. They succeed because they spend their time on the right things.

**The situation**

Ask a CSM how they spend their week and the answer is rarely "building customer relationships and driving strategic value." It's closer to: writing follow-up emails after calls, updating CRM fields, chasing customers for overdue tasks, manually checking which accounts haven't been contacted recently, preparing slide decks for Business Reviews, logging meeting notes, triaging their task list, figuring out which of their 70 accounts needs attention today.

This is the work around the work. It's necessary in the sense that it needs to get done. But none of it is what a great CSM was hired to do. None of it is what customers value. And all of it consumes the time and mental energy that should go toward understanding customers deeply, having meaningful conversations, and making the decisions that actually move relationships forward.

The volume problem makes this worse. As CS teams scale, individual CSMs take on more accounts. The administrative burden grows proportionally. The time available for genuine customer engagement shrinks. And the quality of CS — the thing that actually drives retention and expansion — quietly degrades while the metrics look fine.

***

**The approach**

The goal of automation in CS is not to replace the CSM. It is to remove everything that isn't genuinely CSM work so the CSM can do what only a human can do — build trust, exercise judgment, navigate complexity, and have the conversations that matter.

Great CS is relationship-intensive. It requires knowing your customer's business, understanding their pressures, reading the room in a call, and knowing when to push and when to hold back. None of that can be automated. All of it requires a person who has the time and mental space to actually show up.

What can be automated is everything else. The preparation that happens before every meeting. The follow-up that should happen after every meeting. The monitoring that should be happening continuously across every account. The nudges that should go to customers when tasks slip. The alerts that should reach CSMs when signals change. The routine touchpoints that should happen on a consistent rhythm regardless of how busy the CSM is.

When the routine work runs automatically, the CSM becomes genuinely strategic. Not because they try harder — because the system handles everything that doesn't require them, leaving them free for everything that does.

***

**How to do it in Startdeliver**

**Eliminate meeting prep**

Before every customer call, the AI Assessment gives your CSM a current read on the account — what's changed since the last conversation, what the health signals show, what the recommended action is, and where the customer stands against their goals. There's no need to dig through notes, pull a usage report, or check the support queue manually. The full picture is on the customer profile, updated in real time.

<figure><img src="/files/YFA9NQRqeqtVLf8cqmTw" alt=""><figcaption></figcaption></figure>

The CSM walks into the call informed. Not because they spent 30 minutes preparing — because the platform prepared for them.

→ [How health assessment works](/health-and-metrics/how-to-set-up-health-metrics-and-assessment) · [AI Assessments](broken://pages/uM5YXSGMrvjPefKRa5L0) · [Customer Goals & Success Plans](/managing-customers/customer-goals-and-success-plans)

**Automate meeting follow-up**

After a call, the CSM adds their notes to the customer profile. From there, automations handle the follow-up: a summary email to the customer, a task created for each commitment made, a reminder scheduled for the next check-in. The post-meeting admin that used to take 20 minutes happens automatically in seconds.

<figure><img src="/files/hy2kJQ4nsYhtFAdN0k0E" alt=""><figcaption></figcaption></figure>

Meeting notes also feed the AI — every interaction becomes part of the relationship context the AI reads when producing the next assessment.

→ [Automations](/managing-customers/automations) · [Ongoing — Your actions](/managing-customers/ongoing-your-actions)

**Run onboarding on autopilot**

Onboarding is the most process-intensive part of the customer lifecycle — and the most automatable. A project template defines every step. Automations trigger each phase at the right moment. Shared Space keeps the customer informed and accountable for their tasks without the CSM having to chase. Jecta handles the routine touchpoints — welcome messages, milestone acknowledgments, overdue task reminders — so the CSM focuses on the conversations that need a human.

A CSM running automated onboarding can manage three times the onboarding volume of one running it manually — at the same or higher quality.

→ [Templates & projects](/platform-settings/templates-and-projects) · [Automations](/managing-customers/automations) · [Jecta: AI Agent](/jecta-agent-and-ai/ai-assessments) · [Setting up Shared Space](/managing-customers/shared-space)

**Let the platform prioritize for you**

Every morning, the CSM opens Ongoing and sees their task list, sorted by priority. The AI has already flagged which accounts changed status overnight. The At Risk list shows which customers need attention. The Calendar shows which calls are happening today. The Conversations tab shows which customers have replied and are waiting for a response.

The CSM doesn't spend 20 minutes figuring out where to start. The platform tells them.

→ [Ongoing — Your actions](/managing-customers/ongoing-your-actions) · [AI Assessments](/jecta-agent-and-ai/ai-assessments)

**Never miss a signal**

Startdeliver sends notifications when early risk signals arrive — a drop in usage, a poor survey response, a support ticket going overdue, a customer who has gone quiet. These arrive before the problem becomes visible in a conversation. The CSM gets a heads-up when something changes, not a crisis when it's too late.

Combined with automations that create tasks and send touchpoints when signals appear, the monitoring work that used to require manual weekly reviews happens continuously and automatically.

→ [Automations](/managing-customers/automations) · [How health assessment works](/health-and-metrics/how-to-set-up-health-metrics-and-assessment)

**Let Jecta handle what doesn't need a human**

Jecta is the autonomous CS agent that runs the work between human touchpoints. It reaches out to customers who have gone quiet. It sends check-ins at the right moments. It follows up on overdue tasks. It manages Shared Space updates. It handles the touchpoints that should happen consistently across every account — and escalates to the CSM when something genuinely needs human judgment.

The result is that every customer gets consistent, timely attention regardless of how many accounts the CSM is managing. Jecta handles the volume. The CSM handles the relationship.

→ [Jecta: AI Agent](/jecta-agent-and-ai/ai-assessments)

**Free up strategic capacity**

When the routine work is automated, the CSM has capacity for the work that actually drives outcomes — deep customer conversations, strategic account planning, proactive expansion discussions, Business Reviews that are genuinely consultative rather than just status updates. This is where great CSMs create value. This is what automation makes possible.

***

**What good looks like**

* CSMs start every day knowing exactly which accounts need attention and why — without manually reviewing their full portfolio
* Meeting prep takes 2 minutes instead of 30 — the AI Assessment surfaces everything relevant to the call before it happens
* Post-meeting follow-up is handled automatically — tasks created, emails sent, next check-in scheduled — without the CSM touching a keyboard
* Onboarding runs on a defined process for every customer regardless of how many onboardings are in flight simultaneously
* No customer goes dark because a CSM was too busy — Jecta maintains the touchpoint rhythm across the full portfolio
* CSMs spend the majority of their week on customer conversations and strategic work — not on administrative tasks, data hygiene, or figuring out where to focus
* Retention and expansion improve not because CSMs work longer hours but because they spend their hours on the things that actually matter


# Use case: Head of Customer Success

You're managing the most important thing in the company — the customers. Everything else follows from that.

**The situation**

Customer Success is where the real business happens. Not the pitch, not the signed contract — the moment where your product either delivers on its promise or it doesn't. The CS leader owns that moment, at scale, across every customer the company has ever signed.

That's an enormous responsibility. And it's also enormous leverage. When CS is working well, revenue compounds. Customers expand. Advocates refer new business. NRR climbs. The company builds on a foundation of customers who are genuinely succeeding — and that foundation is more durable than any sales pipeline.

The challenge isn't the importance of the role. It's the visibility. CS creates value continuously, across hundreds of accounts, in ways that are often invisible to the rest of the business. A churn that didn't happen. An expansion that came from a CSM conversation six months before renewal. An onboarding that went so smoothly the customer didn't even notice. These outcomes don't show up in a dashboard unless you build one.

The CS leader's job — whether that's a dedicated Head of CS, a CRO, or a founder managing the customer base directly — is threefold: build the system that makes great CS happen consistently, make the value of that system visible to the rest of the business, and ensure that customer success becomes a company-wide orientation, not just a department.

***

**The approach**

**Own the customer, not just the function**

Customer success isn't something that happens inside the CS team. It happens in product, in support, in marketing, in sales handoffs, in the onboarding experience, in the way pricing is structured. The CS leader who sees their job as managing a team is playing a smaller game than the one available to them.

The most effective CS leaders build a customer success culture — one where every department understands how their work affects customer outcomes, where the health of the customer base is a metric that matters at the board level, and where CS data informs product decisions, sales positioning, and company strategy.

This starts with visibility. When the CEO and CFO can see customer health, NRR trend, and renewal pipeline in real time — not in a monthly report, but always — CS becomes part of the strategic conversation rather than a quarterly update.

**Build a system, not a team of heroes**

Retention and expansion shouldn't depend on which CSM a customer happens to be assigned to. The best CS operations are systematic — every customer gets the same quality of attention, the same onboarding process, the same rhythm of touchpoints, the same early warning when something changes. The individual CSM's skill and judgment matters within that system. But the system is what makes it consistent and scalable.

**Make the invisible visible**

CS creates value that's easy to miss if you're not looking for it. Churn prevented by an early intervention. Expansion generated by a well-timed conversation. A reference customer who came from a relationship built over two years. The CS leader's job is to make this value explicit — in language the board understands, with data that connects CS activity to revenue outcomes.

***

**How to do it in Startdeliver**

**Build the portfolio view that runs the business**

Impact dashboards give you a live view of what matters — health distribution across the customer base, NRR trend, ARR at risk, renewal pipeline, team activity. No spreadsheet to maintain, no report to request. The data is there when you need it — for your own decision-making and for the conversations you have with the CEO, CFO, and board.

<figure><img src="/files/fOcLfKbrlqEKGNj4PxJo" alt=""><figcaption></figcaption></figure>

Build the dashboards that answer the questions you get asked most often. What's our gross retention? Where is churn coming from? Which segments are healthiest? How does health correlate with renewal rate? When CS data is always current and always accessible, it becomes part of how the whole company thinks about the business.

→ [Dashboards & Reports](/dashboards-and-reports/impact-dashboard-templates) · [MRR & ARR](/health-and-metrics/mrr-and-arr)

**See the full picture in real time**

The AI reads every customer continuously and surfaces what matters — at-risk accounts, expansion opportunities, customers approaching renewal, accounts that haven't been contacted recently. You see the full portfolio health at any moment, filtered however you need it — by ARR, by CSM, by segment, by lifecycle stage.

<figure><img src="/files/bYUGYdAwvdKLanfjYRsh" alt=""><figcaption></figcaption></figure>

This changes how you operate. Instead of finding out about a high-value at-risk account in a weekly meeting, you see it the moment the signals change. Instead of asking your team for a status report, you open Startdeliver and the status is there.

→ [How health assessment works](/health-and-metrics/how-to-set-up-health-metrics-and-assessment) · [Lists & filters](/platform-settings/lists-and-filters) · [AI Assessments](broken://pages/uM5YXSGMrvjPefKRa5L0)

**Coach with data, not intuition**

Startdeliver gives you visibility into what's actually happening in accounts — not just what CSMs report. You can see which accounts haven't been contacted recently, which ones have overdue tasks, which ones have drifted quietly while appearing fine. You can see patterns across a CSM's portfolio — where they're strong, where they need support, which account types they struggle with.

<figure><img src="/files/DPIspvdYGIEL94fjzUur" alt=""><figcaption></figcaption></figure>

AI Manager surfaces these patterns proactively — giving you the factual basis for coaching conversations that lead to genuine improvement.

→ [AI Manager](/jecta-agent-and-ai/ai-manager)

**Standardize the motion across the team**

When every CSM runs onboarding the same way, uses the same project templates, follows the same Success Plan structure, and gets the same automated alerts — the quality of CS becomes a function of the system rather than individual talent. This is what makes CS scalable.

<figure><img src="/files/pVJ9EvvqxrXxvT88aUG4" alt=""><figcaption></figcaption></figure>

Build the templates, configure the automations, set the health model, define the lists. A new CSM joining your team should be able to deliver the same quality of CS as your most experienced one within weeks — because the system already knows what good looks like.

→ [Templates & projects](/platform-settings/templates-and-projects) · [Automations](/managing-customers/automations) · [Customer Goals & Success Plans](/managing-customers/customer-goals-and-success-plans)

**Scale without proportionally growing headcount**

As the business grows, the question of how to serve more customers without proportionally adding headcount becomes central. Jecta and automation handle the work that doesn't require a human — consistent touchpoints, early warning outreach, routine follow-up, Shared Space management — so CSMs can carry larger portfolios without sacrificing quality.

This isn't about replacing CSMs. It's about making each one more effective. A CSM supported by Jecta and well-configured automations delivers more to more customers than one working manually. That's the leverage that lets CS scale with the business.

→ [Jecta: AI Agent](/jecta-agent-and-ai/ai-assessments) · [Automations](/managing-customers/automations)

**Make CS a company-wide orientation**

Share the dashboards with the leadership team. Show the correlation between health scores and renewal rates in your next board meeting. When product asks for customer feedback, point them to the experience health data. When sales asks about expansion potential, show them the AI's expansion flags. When the CFO asks about the revenue impact of CS, show them the NRR trend alongside the CS activity that drove it.

<figure><img src="/files/jmQrLu8MVjwQJKYraJ40" alt=""><figcaption></figcaption></figure>

CS data, made visible and accessible, becomes the lens through which the whole company understands its customers. That's the CS leader's most powerful contribution — not the accounts they personally manage, but the customer success culture they build around them.

**Send leadership the weekly digest**

Enable the Executive Report and add your CEO, CRO, and relevant board members as recipients. Every Monday morning they get a one-page summary of ARR, health changes, at-risk accounts, and what the CS team did last week — without anyone having to prepare it.

<figure><img src="/files/mcaslGmmLD68klpcpQhK" alt=""><figcaption></figcaption></figure>

When leadership has a current view of the customer base in their inbox every week, CS stops being something they hear about in quarterly reviews and becomes part of how they think about the business. The customer health conversation becomes ongoing rather than periodic.

→ [Executive Report — Weekly digest](/dashboards-and-reports/weekly-digest-executive-report)

→ [Dashboards & Reports](/dashboards-and-reports/impact-dashboard-templates) · [How health assessment works](/health-and-metrics/how-to-set-up-health-metrics-and-assessment)

***

**What good looks like**

* Customer health is a metric that matters at the board level — visible, current, and connected to revenue outcomes
* You start every week with a live view of portfolio health, renewal pipeline, and at-risk accounts — and so does your CEO
* The quality of CS across your team is consistent regardless of individual CSM experience or workload — because the system enforces the standard
* Your team grows its portfolio without proportionally growing headcount — because Jecta and automation handle the volume work
* Coaching conversations are grounded in account data and activity patterns — specific, factual, and forward-looking
* Every department understands how their work affects customer outcomes — CS isn't a silo, it's the compass


# Team members

The Team page is where you manage everyone who has access to your Startdeliver account.

**Where to find it:** Settings → Team · `app.startdeliver.com/settings/team`

**Who can access it:** Admins only. Regular users cannot view or edit this page.

## What it does

The Team page is where you manage everyone who has access to your Startdeliver account. You can invite new members by email, assign them to a team, control their access level, and archive people who no longer need access.

## Key concepts

### Team member types

Every member is assigned a type that controls what they can see and do in Startdeliver.

| Type                 | What they can do                                                                   |
| -------------------- | ---------------------------------------------------------------------------------- |
| **Administrator**    | Full access to all settings, customers, and account configuration.                 |
| **Main**             | Standard access for day-to-day CS work. Cannot edit account-level settings.        |
| **Lite**             | Reduced access. Suitable for members who need visibility without full edit rights. |
| **External Partner** | Restricted access for partners or contractors outside your core team.              |

### Teams

Teams are groups you create to organise members — for example: Customer Success, Sales, or Support. Each member belongs to one team. Teams are used for filtering and assignment across the platform.

## How to use it

The page has two sections: **Teams** at the top and **Team members** below.

### Teams section

Lists all teams in your account. Click any team name to edit it. Click **+ Create a team** to add a new one and give it a name.

### Team members section

Shows everyone with access to the account. Use the filter tabs to switch between views:

* **All active** — 8
* **Main** — 0
* **Lite** — 0
* **Admin** — 6
* **Invited** — 2
* **Inactive** — 32

Filter tabs showing counts for each member status. The **Invited** tab shows people who have been sent an invitation but have not yet accepted.

Each row shows the member's **Name** and email, their **Team**, their **Active** status, and their **Team Member Type**. Click the three-dot menu (⋮) at the right of any row to manage that member.

**Manage team member**

* **Edit team member** — Edit the team member details
* **Change email** — Change the team member's email address
* **Archive** — Archive and anonymize the team member

The three-dot menu (⋮) on each member row. **Archive** removes access and anonymizes the member's data.

## How to invite a new team member

{% stepper %}
{% step %}

#### Go to Team

Go to **Settings → Team**.
{% endstep %}

{% step %}

#### Start the invite

Click **+ Invite team member** in the top right of the Team members section.
{% endstep %}

{% step %}

#### Enter member details

Enter the member's **Name** (required) and **Email** (required).
{% endstep %}

{% step %}

#### Add optional details

Optionally add a **Phone Number**.
{% endstep %}

{% step %}

#### Choose a team

Select a **Team** from the dropdown.
{% endstep %}

{% step %}

#### Choose a team member type

Select a **Team member type**. **Main** is selected by default.

* Administrator
* Main
* Lite
* External Partner
  {% endstep %}

{% step %}

#### Send the invite

Click **Invite now**.
{% endstep %}
{% endstepper %}

The invited person receives an email with a link to set their password. Until they accept, they appear under the **Invited** filter tab and cannot log in.

## How to create a team

{% stepper %}
{% step %}

#### Go to Team

Go to **Settings → Team**.
{% endstep %}

{% step %}

#### Start creating a team

Click **+ Create a team** in the top right of the Teams section.
{% endstep %}

{% step %}

#### Name the team

Enter a name for the team (for example: Customer Success, Sales, Support).
{% endstep %}

{% step %}

#### Save

Save. The team is immediately available to assign to members.
{% endstep %}
{% endstepper %}

## Common scenarios

### Adding a new CSM who just joined the team

Go to Settings → Team, click **+ Invite team member**, enter their name and work email, select the Customer Success team, leave the type as **Main**, and click **Invite now**. They will receive an email to set their password and can log in straight away once they accept.

### Giving a colleague Administrator access

Invite them as above but select **Administrator** as the team member type. Administrators can edit all settings, manage other team members, and configure the full account. Only grant this to people who genuinely need it.

### Removing access for someone who has left

Find the person in the Team members list, click the three-dot menu (⋮) on their row, and select **Archive**. They immediately lose access and their data is anonymized. Archived members do not appear in active lists but their historical activity remains in the account.

## Support access

At the bottom of the Team page is a separate **Support access** section. This lets you designate one team member for Startdeliver's support team to use during onboarding or troubleshooting. This member does not count toward your plan seat limit and can be activated or deactivated at any time.


# Permissions

**Settings → Permissions** · Requires Admin access to configure

Configure who on your team can see and do what in Startdeliver. Permissions are built around **Team Member types** - roles you assign to each team member that control exactly what customers, data, and settings they can access.

## How it works

There are two components:

* **Team Member types** — the roles themselves, each with their own permission configuration. You assign a type when inviting or editing a team member.
* **Permission rules** — reusable rule sets you build once and apply to any number of types. Useful when multiple types should share a specific permission configuration.

## Team Member types

### Default types

Three types come built in and cover most CS team structures.

| Type  | Who it's for                                                                                              |
| ----- | --------------------------------------------------------------------------------------------------------- |
| Admin | CS managers, operations leads, anyone who configures the platform. Full account access.                   |
| Main  | Standard CSMs. The default for any team member who isn't an admin.                                        |
| Lite  | Observers, stakeholders, or junior team members who need visibility with limited ability to make changes. |

Default types cannot be deleted, but their permissions can be fully customised.

### Custom types

Create a custom type when the defaults don't match your team structure. Common examples: Team Lead (full access to their team's portfolio), Revenue Operations (read-only across all accounts), or Specialist (write access to specific objects only).

Go to **Settings → Permissions** and click **+ Add a custom Team Member type**.

### Partner types

For external collaborators — resellers, integration partners, agency partners. The built-in **External Partner** type is available by default. Partner types follow the same permission model but are kept separate from internal types.

Click **+ Add a partner Team Member type** to create additional partner types.

## Permission categories

Each Team Member type is configured across the following categories:

### Customers and their related objects

The most important category. Controls access to customer records and all objects attached to them — Users, Projects, Tasks, Files, and Comments.

This category has two sub-sections:

* **Permissions for customer items** — the 4 core actions (Read, Write, Create, Delete) on the customer record itself, plus field visibility controls
* **Permissions for related items** — actions on all related items except customers

You can also add **child entities** to configure individual object types separately — for example giving a type different permissions on Tasks vs Files vs Comments. See the full entity list below.

### Team members, Teams, Permissions, and other access

Controls whether a member can manage people and roles. Contains three specific controls:

| Control                      | What it does                                       |
| ---------------------------- | -------------------------------------------------- |
| Grant admin                  | Whether this type can grant admin rights to others |
| Team Member type permissions | Whether they can create or use Team Member types   |
| Invite                       | Whether they can invite new team members           |

### Settings access

Controls access to personal, team, and account-level settings.

### Advanced settings access

Fine-grained control over specific account configuration keys. Use this to lock down sensitive platform settings for non-admin types.

### Route access

Controls access to non-entity routes such as file upload, download, and connected apps. Available on Main and custom types.

### Permissions for general objects

Controls access to non-customer objects — shared templates, global playbooks and other account-wide resources.

Use this when you need to give a team member access to one specific resource without opening up the entire category. For example, give a partner access to a single project template without granting access to all templates.

To whitelist specific objects: open the permission settings for the relevant type → find the object category → select the objects you want to allow.

## Permission levels

For customer-related categories, each action (Read, Write, Create, Delete) can be set to one of six levels:

| Level                     | What it means                                                                 |
| ------------------------- | ----------------------------------------------------------------------------- |
| Same as default           | Inherits the account-wide default. Start here and only override where needed. |
| Assigned customer         | Allowed only on customers this team member is personally assigned to          |
| Team's assigned customers | Allowed on customers assigned to this team member or anyone on their team     |
| Created customer          | Allowed only on customers this team member created                            |
| Team's created customer   | Allowed on customers created by this team member or anyone on their team      |
| None                      | Never allowed, regardless of assignment or team                               |

For non-customer categories (Team members, Settings, Route access), permissions use simpler **Has Access / No Access** controls with specific sub-options per action.

## Field visibility

Within customer permissions, you can control which fields are visible to a type. Two modes:

* **All visible** (default) — all fields are shown. Select individual fields to hide.
* **All hidden** — all fields are hidden. Select specific fields to show.

Use this when different roles need different views of a customer record. For example, a Lite user might not need to see ARR, internal notes, or health score details.

To configure: open the permission settings for a type → **Customers and their related objects** → expand **Permissions for customer items** → scroll to **Field visibility**.

Use **+ Add field override** to apply visibility rules to individual fields under specific conditions.

## Child entities

Within the Customers category, you can configure permissions for specific related objects separately from the default. Click **Add child entity** and select from the dropdown.

## Permission rules

Permission rules are reusable configurations you build once and apply to multiple types. Instead of manually setting the same scope on several types, create a rule and reference it wherever needed.

To create: **Settings → Permissions → + Add a custom Permission** under the Permission rules section.

## How to create a new Team Member type

1. Go to **Settings → Permissions**
2. Click **+ Add a custom Team Member type**
3. Give it a name and description
4. Click into each permission category and configure the scope for each action
5. Optionally configure field visibility for customer records
6. Click **Save** — the type is now available when inviting or editing team members

## How to assign a type to a team member

1. Go to **Settings → Team**
2. Find the team member and click to edit
3. Select their type from the dropdown
4. Save

You can also set the type when inviting a new team member.

## Common setups

### Standard CSM team

Use the **Main** type. Set Write and Delete to "Assigned customer" so CSMs can only edit their own accounts. Keep Read as "Same as default" so they have full portfolio visibility for context.

### Team lead with full team access

Create a custom type. Set all actions to "Team's assigned customers". The lead can read and edit any account their direct reports are assigned to.

### Read-only stakeholder

Use **Lite**, or create a custom type with Read set to "Same as default" and Write, Create, Delete all set to "None".

### External partner with limited field access

Use a Partner type. Set Delete and Create to "None". Use Field visibility in "All hidden" mode and expose only the fields relevant to the partner relationship.

### Locked-down junior CSM

Set Read to "Assigned customer" across the board. They only see what they're directly assigned to — no portfolio-wide visibility.

### Hiding sensitive fields from a type

Use "All visible" mode and add the fields you want to hide under Field visibility. ARR, health scores, and internal notes are common candidates for field-level restrictions.


# Customer profile settings

The customer profile is what every CSM looks at dozens of times a day.

### Customer profile settings

**Where to find it:** Settings → Views → Customer view **Who can access it:** Admins only

The customer profile is what every CSM looks at dozens of times a day. This page lets you configure what appears on it — what data shows in the header, what sections appear in the sidebar, and how the custom fields page is organised.

There are three areas to configure.

***

#### Customer header

The header appears at the top of every customer profile. It shows the AI Health Assessment panel and a row of metric tiles below it.

The assessment panel is fixed — it always shows the current assessment status, the plain-language summary, the trend line, and the Take Action button.

<figure><img src="/files/U1psTyJjsF00wDRKjOBw" alt=""><figcaption></figcaption></figure>

The metric tiles below it are configurable. By default they show ARR, Usage health, Feedback health, and Support health. You can add, remove, and reorder tiles to surface the data points most relevant to your team.

**Common customizations:**

Payment status — a Boolean field (Yes/No) styled as an alert tile, colour-coded red when overdue. Useful for flagging late payments without the CSM having to dig into billing.

Customer tier — a dropdown field (Enterprise, Mid-market, SMB) shown as a coloured badge. Lets CSMs see segment at a glance without opening the full profile.

Product-specific KPIs — any numeric field can be shown as a tile. An e-sign provider might surface number of signed contracts. A project management tool might show active projects. Any metric that defines success for your customers can live here.

Tiles support colour coding based on field values or thresholds, so you can set up visual alerts when a metric crosses a boundary your team cares about.

{% embed url="<https://www.loom.com/share/7e8b608193454b7aac6e6104579aa4a3>" %}

**To configure the header:** Go to Settings → Views → Customer view → Customer header. Add or remove tiles, set display names, and configure colour rules per tile.

***

#### Customer sidebar

The sidebar is the left-hand navigation on the customer profile. It controls which sections are available and in what order.

Default sections include Users & Stakeholders, Ongoing (tasks and projects), Comments & Conversation, and Customer Goals. You can add, remove, and reorder these to match how your team actually works.

{% embed url="<https://www.loom.com/share/5c5a739d063e4d0b9be3f8557c55be5a>" %}

**To configure the sidebar:** Go to Settings → Views → Customer view → Customer sidebar.

***

#### Customer custom fields page

Each customer profile has a dedicated page for custom field data — information that doesn't live in the header but that your team needs to record and reference. This setting controls the layout of that page: which fields appear, how they're grouped, and in what order.

{% embed url="<https://www.loom.com/share/e01b48b78e1742a89d9dfdf4fb9ea16f>" %}

**To configure the custom fields page:** Go to Settings → Views → Customer view → Customer custom fields page.

***

#### Customer status

Customer status is a separate setting that controls the lifecycle stage label shown on each customer profile — visible just below the customer name in the profile header.

Most teams use status to track where a customer is in their journey: Onboarding, Adoption, Engagement, Expansion, Renewal, Churned. You define the stages that match your own process.

Status is also available as a filter in lists, so you can instantly pull up all customers in Onboarding or all customers approaching Renewal.

{% embed url="<https://www.loom.com/share/91fcded2f6d748919a0199f24e47287e>" %}

**To configure customer statuses:** Go to Settings → Customer status. Click Add new status, give it a name, and save. You can reorder statuses by dragging them into the sequence that reflects your customer journey.

{% embed url="<https://www.loom.com/share/0ca4b3e6f2f24d0fa0c594cef3fb0da7>" %}


# Custom fields

Custom fields let you store any data point on customers, users, and team members that isn't covered by Startdeliver's standard fields.

### Custom fields

**Where to find it:** Settings → Fields **Who can access it:** Admins only

Custom fields let you store any data point on customers, users, and team members that isn't covered by Startdeliver's standard fields. Once created, fields are available across the platform — in customer profiles, lists, filters, health scoring rules, automations, and Shared Space.

***

#### Field types

| Type     | Use it for                                                                       |
| -------- | -------------------------------------------------------------------------------- |
| Text     | Free-form strings — notes, categories, identifiers                               |
| Number   | Numeric values — ARR, seat count, contract value, usage metrics                  |
| Date     | Calendar dates — renewal date, contract start, churn date                        |
| Boolean  | Yes/No flags — paid invoice, trial customer, high-touch flag                     |
| Dropdown | Fixed option lists — customer tier, region, plan type                            |
| Dynamic  | Values that update automatically based on connected data sources or calculations |

***

#### Field visibility

Each field has a visibility setting that controls where and how it appears.

**Editable** — the field is shown on the customer profile and can be edited directly. Use this for fields your CSMs update as part of their workflow.

**Visible** — the field is shown on the customer profile but cannot be edited from there. Use this for fields populated by integrations or imports where manual editing would cause conflicts.

**Hidden** — the field does not appear on the customer profile but is available in lists, exports, filters, and automations. Use this for backend data your team doesn't need to see day-to-day but that feeds health scoring or reporting.

***

#### Field options

**Multi values** — allows a field to hold more than one value. Useful for things like tags, product lines a customer uses, or multiple contact roles.

**Related values** — links the field to another object in the platform. For example, a Contact Person field can relate to a user record rather than storing a name as plain text.

**Shared Space** — makes the field visible inside the customer-facing Shared Space. Use this selectively — only expose fields that are meaningful to the customer.

***

#### Applying fields

Fields apply across the object type they are created for. Customer fields appear on all customer profiles. User fields appear on all user profiles. Team member fields appear on team member records.

Once created, a field is immediately available to use in lists and filters. To make it visible on a customer profile, configure it in Settings → Views → Customer view.

***

#### How to create a field

{% embed url="<https://www.loom.com/share/699d98b05c784d8c827c5125768c146d>" %}

1. Go to Settings → Fields
2. Click Add field in the Customer fields, User fields, or Team member fields section
3. Enter a Name — this is what appears in the UI
4. The Alias is auto-filled from the name and is used as the API identifier. You cannot change the alias after creation
5. Select a Type
6. Set Visibility
7. Toggle Multi values, Related values, or Shared Space if needed
8. Mark Required if the field must be filled before a customer or user can be created
9. Save

***

#### Common scenarios

**Tracking whether a customer has paid their invoice** Create a Boolean field called Invoice paid. Set Visibility to Editable so CSMs can update it directly. Add it to the customer header as a colour-coded tile — red when No, green when Yes.

**Filtering customers by tier** Create a Dropdown field called Customer tier with options Enterprise, Mid-market, and SMB. Set Visibility to Editable. It immediately becomes available as a filter in any list and as a header tile on the customer profile.

**Feeding a product-specific KPI into health scoring** Create a Number field for the metric — for example Signed contracts for an e-sign provider. Set Visibility to Hidden if CSMs don't need to see it directly. Connect it to a health scoring rule in Settings → Health.


# Lists & filters

Lists are saved views of your customer or user portfolio. You filter, sort, and configure columns once — then save the view so you and your team can return to it instantly.

**Customers → select or create a list** · Available to all team members

Lists are saved views of your customer or user portfolio. You filter, sort, and configure columns once — then save the view so you and your team can return to it instantly. Every list is independent, so you can have a different set of columns, filters, and widgets per list.

## Common lists to start with

* **Onboarding** — customers currently being onboarded
* **At risk** — customers showing warning signs or potential churn risk
* **On track** — customers progressing as expected
* **Expansion opportunities** — customers who could be upgraded
* **Renewals** — customers approaching their renewal date

<figure><img src="/files/8volNcl9sv2HOtV6gxZk" alt=""><figcaption></figcaption></figure>

## Creating a list

### From scratch

1. Go to the **Customers** or **Users** view
2. Click **+ Create new** next to the list tabs at the top
3. Add filters, configure columns, and set up any widgets you need
4. Click the list name and select **Save list changes**

{% embed url="<https://www.loom.com/share/e15123da3fa94cf7bca2eeff29c6e632>" %}

### By copying an existing list

If you need two similar lists, copy one to avoid rebuilding filters and columns from scratch.

1. Open the list you want to copy
2. Click the list name and select **Duplicate list**
3. Adjust the filters or columns as needed
4. Save the new list

{% embed url="<https://www.loom.com/share/779e8c8cf6bc4b16a46911d0dcc57796>" %}

**Important:** Any time you change filters, columns, or sort order, you must save the list to keep those changes. A pen icon appears next to the list name whenever there are unsaved changes.

## Filtering

Filters are built from the fields on your customer or user records — both standard fields and any custom fields you have set up. The available filter options depend on the field type.

<figure><img src="/files/JX37WECXCzqLA93cTO9K" alt=""><figcaption></figcaption></figure>

A useful pattern is to use **Current signed in** as the Team Member filter. This makes the list dynamic — each CSM who opens it sees their own customers, so you can share one list across the whole team without creating individual copies.

## Customizing a list

### Columns

Click the pen icon on the right side of the list header to edit columns. Select which fields to show and drag them into your preferred order. Save the list after making changes.

<figure><img src="/files/v74hiXG1SWA9B14WgOne" alt=""><figcaption></figcaption></figure>

### Widgets

Click **Customize list** on the right side of the screen to add widgets. Widgets create segments within your list — for example a count of customers in Onboarding, one for Expansion, and one for At risk — giving you a quick summary at the top of the view.

<figure><img src="/files/54Y9NKKeRf0pF3FvwZmx" alt=""><figcaption></figcaption></figure>

### Sharing a list

From the **Customize list** panel you can share a list with other team members so they can access it from their own navigation.

## Common scenarios

### My CSMs each need their own portfolio view

Create one list with a Team Member filter set to **Current signed in**. Share it with the whole team. Each CSM opens the same list and sees only their own customers — no separate lists needed.

### I want to track customers by renewal month

Create a list filtered by renewal date range, with ARR and renewal date as visible columns. Duplicate it for each quarter and adjust the date filter. Save each as a separate list.

### I need a manager view across all CSMs

Create a list with no Team Member filter so all customers are visible. Add Team Member as a column so ownership is clear at a glance. Save and share with the manager.


# Main menu

Configure the left-hand navigation to match how your team works.

**Where to find it:** Settings → Views → Main Menu

<figure><img src="/files/NSoMw4eJ08oGn7EhReOk" alt=""><figcaption></figcaption></figure>

**Who can access it:** Admins configure the account menu. All team members can configure their personal menu if allowed by an admin.

***

#### What it is

The main menu is the left-hand navigation in Startdeliver. It has two parts — the account-wide menu that admins configure, and a personal menu that individual team members can create for themselves.

***

#### Account menu

The account menu is the default navigation shown to everyone on the account.

**Default menu**

The default menu is the fallback menu shown to everyone without a matching criteria. Configure it with the items your whole team needs.

Add items, reorder them by dragging, and group related items into sub-menus.

**Sub-menus**

Sub-menus group items under a collapsible section. Use them to keep navigation clean when you have many lists or pages.

**Alternative menus**

Alternative menus let you create additional menus that show when certain criteria are met.

<figure><img src="/files/Sbloa6oKP1VMLzuN5xIf" alt=""><figcaption></figcaption></figure>

The first matching criteria takes priority. Drag and drop menus to set the order.

Use this when different team member types need different navigation. For example, partners can have a menu that only shows what is relevant to them.

{% hint style="info" %}
Multiple menu configurations require an upgrade.
{% endhint %}

**Allow personal menu**

Turn on **Allow personal menu** to let team members create their own personal menu.

Turn it off to lock everyone to the account menu.

***

#### My menu

<figure><img src="/files/hxrt2JOszXbxYnpuIN6p" alt=""><figcaption></figcaption></figure>

Team members can create a personal menu that overrides the account menu for them only.

Go to **Settings → Views → Main Menu → My menu** to set it up.

Use this to tailor the navigation to your own workflow without affecting the rest of the team.

***

#### Common ways to use it

**Keep the default menu simple**

Put the views and pages everyone needs in the default menu. Use sub-menus for less frequent items.

**Create role-based navigation**

Use alternative menus when different roles need different entry points. This is useful for partners, managers, or specialist teams.

**Let power users customize their own view**

Turn on personal menus when team members work in different ways but still need the same underlying data.

***

#### Related pages

* [Team members](/platform-settings/team-members)
* [Permissions](/platform-settings/permissions)


# Templates & projects

Templates define the standardised ways your team runs recurring customer work.

### Templates & projects

**Where to find it:** Settings → Templates **Who can access it:** Admins only

Templates define the standardised ways your team runs recurring customer work. Build a template once, apply it to any customer, and every project starts from the same consistent structure.

There are three template types: Project templates, Task templates, and Messaging templates.

***

#### Project templates

Project templates are the most used template type. They define the full structure of a recurring customer project — the tasks involved, the timeline, and how the project behaves once it's running.

**What a project template contains:**

Tasks — each task in the project, with a name, optional description, and snooze days (how many days after the project starts before the task becomes active).

Due date — how many days the overall project should take to complete. This sets the deadline when the template is applied to a customer.

Automations — triggers that fire based on project activity. For example: when all tasks in this project are completed, automatically launch the next project template. Used to chain onboarding into adoption into renewal without manual intervention.

Shared Space — project templates can include Shared Space content, so when the project is applied to a customer their Shared Space is automatically populated with the relevant materials.

**Common project templates:**

* Onboarding — the sequence of steps from signed contract to live customer
* Business Review — the preparation and follow-up tasks around a QBR
* Renewal — the outreach and negotiation steps ahead of renewal date
* Offboarding — the structured wind-down for a churning customer
* Upgrade — the steps for moving a customer to a higher tier

**To create a project template:** Go to Settings → Templates → Project templates. Click Create template, give it a name, add tasks with snooze days, set a due date, and configure any automations or Shared Space content.

{% embed url="<https://www.loom.com/share/cabc4863ec5f46deb6d929129c90c059>" %}

**Applying a project template to a customer:** Open the customer profile, go to the Ongoing section, and select New project. Choose a template from the list. The project is created immediately with all tasks and the due date calculated from today.

Project templates can also be triggered automatically via automations — for example, launching an onboarding project the moment a new customer is created.

***

#### Task templates

Task templates define reusable individual tasks — not full projects, but single assignments your team runs repeatedly.

Common uses: sales handover tasks, annual Business Review prep, recurring check-in meeting notes. Any task your team creates more than once is a candidate for a task template.

{% embed url="<https://www.loom.com/share/9d10e80443e04cf0a0a4d2623d51c1c0>" %}

**To create a task template:** Go to Settings → Templates → Task templates. Build the task structure once and save it.

***

#### Messaging templates

Messaging templates are saved message drafts your team can send from within Startdeliver — welcome emails, kick-off messages, meeting requests, and any communication you send repeatedly.

Saving a message as a template means your team isn't writing the same email from scratch every time. It also keeps communication consistent across CSMs.

Use messaging templates when sending from a customer profile or through an automation. → [Email](/managing-customers/sending-emails)

**To create a messaging template:** Go to Settings → Templates → Messaging templates. Write the message, give it a name, and save. It will be available to all team members when composing messages from a customer profile.

***


# Notifications

Control notification defaults, team overrides, and personal preferences.

**Where to find it:** **Settings → Notifications**

**Who can access it:** All team members can manage **Your notifications**. Only admins can manage **Account notifications** and **Team notifications**.

{% hint style="info" %}
In-app notifications appear in the profile menu. A red badge shows unread items. The **Notifications** tab shows notification details. The **Activity** tab shows items marked as **Indicate Activity**.

See [How notifications appear](#how-notifications-appear) for more detail.
{% endhint %}

## What it does

Notifications let you control which events trigger alerts and how they are delivered.

You can configure notifications at three levels. The most specific setting always wins.

## Notification levels

| Level                     | Scope                                  | Override behavior                                                  |
| ------------------------- | -------------------------------------- | ------------------------------------------------------------------ |
| **Account notifications** | Default settings for the whole account | Applies to everyone unless a team or personal setting overrides it |
| **Team notifications**    | Settings for one team                  | Overrides account defaults for that team                           |
| **Your notifications**    | Personal settings for one team member  | Overrides both team and account settings                           |

The cascade is:

`Account < Team < Personal`

## Notification groups

Events are grouped by entity and ownership so you can tune alerts in bulk.

### Built-in groups

* **Assigned customers** — Events for customers assigned to a team member
* **Involved projects** — Events for projects where a team member is involved
* **Assigned tasks** — Events for tasks assigned to a team member

Depending on your setup, you may also see other groups, such as **Team's customers**, or custom groups created in your account.

You can also click **+ New notification group** to create your own filtered groups.

## Delivery channels

Each event can be configured per channel.

| Channel     | Available options                                   |
| ----------- | --------------------------------------------------- |
| **In app**  | **Notification**, **Indicate Activity**, or **Off** |
| **Email**   | Coming soon                                         |
| **Summary** | Coming soon                                         |

#### In app options

| Option                | What it does                                                  |
| --------------------- | ------------------------------------------------------------- |
| **Notification**      | Appears in the **Notifications** tab with a red badge counter |
| **Indicate Activity** | Added to the **Activity** tab as a counter                    |
| **Off**               | Not shown anywhere                                            |

## How notifications appear

In-app notifications appear in two places:

* A red badge on the profile avatar in the main menu shows the unread **Notifications** count
* Clicking the profile avatar opens the notification bar on the **Notifications** tab
* The **Notifications** tab shows notification details
* The **Activity** tab shows items configured as **Indicate Activity**

Use the filters at the top of the **Notifications** view to control what you see:

* **Only unread** shows unread items only
* **Show all** includes read items
* **Mark all as read** clears the unread count

#### Grouped view

Use **Grouped** to reduce noise from repeated events on the same item.

Grouped view combines related events into one notification thread instead of showing each event separately.

This works well for high-activity records, such as customers or projects with many updates in a short period.

Open the grouped notification to review the latest change without scanning a long list of near-duplicate alerts.

## How to configure notifications

{% stepper %}
{% step %}

#### Choose the level

Open **Account notifications**, **Team notifications**, or **Your notifications** depending on where you want the rule to apply.

Only admins can edit **Account notifications** and **Team notifications**.
{% endstep %}

{% step %}

#### Find the right group

Pick the notification group that matches the work you want to monitor, such as **Assigned customers** or **Assigned tasks**.
{% endstep %}

{% step %}

#### Change one event or many

Click any cell to change the delivery method for one event.

Click a column header to apply the same delivery method to every event in that group.
{% endstep %}

{% step %}

#### Set the default for future events

Use **Default for new event types** to decide how newly added events should behave in that group.

The default can be left on **Auto** or changed to a specific delivery method.
{% endstep %}
{% endstepper %}

## What you can change on this screen

Each notification group opens a list of event types.

For each event, you can set the channel behavior individually.

You can also:

* Click an **In app** column header to update all events in that group at once
* Use **+ Add event** to add another event to the current eligible group
* Use **+ New notification group** to create a custom group

## Add event

**+ Add event** lets you add event types that are not included in a notification group by default.

You can also add a filter so the event only triggers for specific items.

For example, you can notify only for customers in a specific segment.

**+ Add event** is only available in **Account notifications** for eligible groups.

It is not shown for every group.

Groups that already reference a base group do not show **+ Add event**.

## New notification group

**+ New notification group** lets you create a custom notification group for a specific subset of items.

This takes two steps:

1. Pick an entity type: **Customer**, **Project**, **Task**, or **Comment**
2. Choose the scope:
   * **All** — all items of that type in the account
   * **Team** — items assigned to the team
   * **Custom** — define a name and add a filter to control exactly which items trigger notifications

Not every entity type supports every scope option.

For example, some entity types may only show **Custom**.

Use this when the standard groups are too broad.

For example:

* enterprise customers only
* projects in the onboarding phase only

## How defaults work

**Default for new event types** controls what happens when Startdeliver adds a new event to an existing group.

If it is set to **Auto**, new event types use the system default.

Change it when you want to override that default before new event types appear.

For example, set it to **Off** if you want future event types in that group to stay muted automatically.

## Common scenarios

### We want account-wide defaults, but teams need flexibility

Set the broad baseline in **Account notifications**. Then let each team adjust only the groups that differ for their workflow.

### A user wants fewer notifications than the rest of the team

Keep the team settings as they are. The user can reduce noise in **Your notifications** without changing anyone else.

### We want to avoid noise from future event types

Set **Default for new event types** to **Off** in the relevant group. New events in that group stay muted unless someone enables them later.

### We need a focused notification set for one subset of customers

Create a **+ New notification group** and use a **Custom** scope with filters. This works well for cases like enterprise customers, renewal-risk accounts, or any segment your team wants to watch closely.

{% hint style="info" %}
Only the **In app** channel is currently available. **Email** and **Summary** are planned.
{% endhint %}


# How to set up health metrics & assessment

The full picture of every customer, assessed continuously and automatically by AI.

#### The model

Startdeliver assesses every customer automatically, continuously, and without your team having to do anything manually. The AI reads all available signals and context — product usage, customer feedback, support activity, relationship engagement, and more — combines them with what it knows about your specific business and customers, and produces a plain-language verdict your team can act on immediately.

This is not a scorecard your admins maintain. It is not a weighted formula you tune once and forget. It is an AI that reads everything it knows about each customer and tells you where they stand and what to do next.

***

#### Key indicators

The assessment draws on all the data connected to Startdeliver. The more signals flowing in, the richer and more accurate the picture. Key indicators include:

**Product usage** How well the customer is actually using your product. Measured against goals you define per product — the right level of engagement for your specific use case, not a generic benchmark. Tracks individual users and rolls up to the customer level. → \[Product usage health]

**Customer experience** How the customer feels about your product and service. Driven by survey responses pulled automatically from your feedback tools. The AI reads sentiment patterns across respondents, not just individual scores — identifying potential advocates as well as customers sending an early warning signal. → \[Experience health]

**Support activity** The state of the customer's support relationship — open tickets, delayed tickets, resolution history. Unresolved support issues are often the earliest visible signal of a customer losing confidence. → \[Support health]

**Relationship engagement** The full picture of how your team and your customer are actually interacting — emails, messages, meeting notes, internal comments, Shared Space activity, task completions, document interactions, and collaboration. A customer who is active in the product but silent in every other channel is a different risk profile from one who is communicating regularly and engaged in their Shared Space. The AI reads the presence and recency of relationship activity as a signal of how alive the partnership actually is — not just whether the product is being used.

**Goal progress** Whether your customers are on track toward the business outcomes they are trying to deliver. Goals reflect what your customer sold their own customers — a CRM company's customer goal might be growing sales, an HR company's might be reducing cost-per-hire, an e-sign company's might be faster contract cycles. The AI reads goal progress alongside usage, feedback, support, and relationship signals — connecting product adoption to business trajectory. A customer with strong usage who is falling behind on their stated business goal is a different situation from one who is simply inactive. The AI reads that distinction and flags it.

**And more** As you connect more of your stack — your CRM, your billing tool, your product analytics — the AI has more context to work with. Every connected data source makes the assessment more complete and the recommended actions more precise.

***

#### What the AI does with all of this

The AI does not average signals into a number. It reads everything together as a complete picture of the customer relationship, in the same way a good CSM would if they had time to review every data point on every customer every day.

A customer with strong usage, poor survey feedback, an overdue support ticket, and two months of silence from your team is not a percentage-healthy customer. They are a customer with a specific pattern that calls for a specific response. The AI reads that pattern and tells your team exactly what it sees and what to do about it.


# Product Usage Health

Product usage health measures how well your customers are actually using your product.

### Product usage health

<figure><img src="/files/gQcFhp1AcfroxYkj4hlj" alt=""><figcaption></figcaption></figure>

**Where to find it:** Settings → Products **Who can access it:** Admins only to configure. All team members see the results on customer profiles.

***

#### What it is

Product usage health measures how well your customers are actually using your product. It is not a single number — it is a per-product signal, calculated continuously, that tells your team whether each customer is engaging with your product in a meaningful way.

The result shows on the customer profile as a color-coded health indicator per product (Good / Fair / Poor), and feeds into the overall AI Health Assessment alongside experience and support signals.

***

#### How it works: the model

You define what "good" usage looks like for each product. Startdeliver then measures every customer against that definition, continuously, and produces a health status.

The model has three components you configure per product: the goal type, the goal targets, and the usage types attached to it.

***

#### Step 1 — Create a product

Go to Settings → Products and click Create new product.

Every product in Startdeliver represents something you want to measure usage for. This could be your core product, a module, an add-on, a feature area, or any discrete thing where usage matters. The demo account shows examples like Core Features, Analytics, Add-on 1, Add-on 2, and Logged in — each tracked independently.

**Product settings:**

**Name** — what the product is called across the platform.

**Abbreviation** — 1 to 3 characters shown on the customer profile header tile (e.g. COR for Core Features).

**Number of days to look for usage** — the rolling window Startdeliver uses when calculating health. Default is 35 days. Adjust this to match how often your customers naturally use the product — a daily-use tool might use 30 days, a quarterly-review tool might use 90.

**Exclude from average health** — tick this to track the product's health without it contributing to the customer's overall usage health score. Useful for optional add-ons, nice-to-have features, or products in beta where poor usage shouldn't penalise the overall health.

**Product weight in average health** — optionally weight this product more or less than others in the average. Set 2 to count it twice, 0.5 to count it half as much. Leave as Auto for equal weighting.

***

#### Step 2 — Set the goal type

The goal type defines what "usage" means for this product. Choose the one that best reflects how your product should actually be used.

**Unique days** The product should be used on a certain number of distinct days in a rolling month. Frequency matters more than volume — a customer who logs in 10 days is healthier than one who does everything in one session then disappears.

Use this for: core products where consistent daily or weekly engagement is the definition of good adoption.

**Usage count** The product should accumulate a total number of usage events in a rolling month. Individual session patterns don't matter — it's the total that counts.

Use this for: products with flexible usage patterns where the event volume is what's meaningful, not the spread across days.

**Depended count** The product's health goal scales with the volume of another usage event. The target is not a fixed number — it's proportional to how much of something else is happening. For example: the number of reports exported should be at least 20% of the number of dashboards created.

Use this for: features that should be used in proportion to other activity, where a fixed target would be misleading.

**Unique quota** A certain percentage of users should be performing specific usage events within a time period. Tracks breadth of adoption across the user base, not just volume.

Use this for: products where seat utilisation matters — you want to know that enough of the customer's users are active, not just that some power users are doing everything.

**Field value** Health is calculated based on a value stored in a custom field on the customer or user record, rather than live usage events. Use this when health data comes from an external system or calculation that you import into Startdeliver as a field value.

Use this for: products where the source of truth for usage lives outside the event tracking system.

***

#### Step 3 — Set goal targets

Goal targets define the thresholds for Good, Fair, and Poor. Anything below Fair is automatically Poor — you only need to set where Fair starts and where Good starts.

**Customer or user usage** — choose whether health is calculated per user or for the customer as a whole.

* **User** — each user is measured individually against the goal. Then the percentage of users achieving the goal determines the customer's overall product health.
* **Customer** — usage is measured in aggregate across all users. One large power user can compensate for inactive others.

**Goal count** — the number of times (or days, or events, depending on goal type) that constitutes Fair and Good usage for a single user or the customer total.

**Number of users** — when using User-based calculation, you set what percentage of users need to achieve Fair or Good for the customer's health to reflect that. For example: if 50% of users are achieving fair usage, the customer is Fair. If 80% are, they're Good.

The sliders in the UI let you set these thresholds visually. The platform shows you in plain language what the rule means as you configure it: "For one user to achieve fair usage, how many times in a rolling month should a usage event occur?"

**Advanced goal options** (visible depending on goal type):

* **Only count users with this product** — limits health tracking to users who have the product assigned, ignoring others. Useful for products with distinct user subsets.
* **User goal from a field value** — instead of a fixed goal count, the target is pulled from a custom field value per user or customer. Enables dynamic, account-specific targets.
* **No news is good news** — inverts the logic: a lower count is healthier. Use for things like support tickets opened, errors triggered, or downtime events, where fewer is better.
* **No fair** — removes the Fair band entirely. Customers are either Good or Poor. Use when there's no meaningful middle state.
* **Adjust for recent activity** — softens health targets for new customers who have recently been activated, accounting for the fact that they haven't had time to build up usage history.

***

#### Step 4 — Attach usage types

Usage types are the individual events that feed this product's health calculation. They are the raw signals — things like "Logged in", "Created dashboard", "Exported report", "Added page as favorite" — that your product sends to Startdeliver via the API.

Go to the Usage Types tab on the product. You'll see all available usage events in your account. Click any row to attach or detach it from this product.

One usage event can be attached to multiple products. A "Logged in" event might feed both your Core Features health and a Logged in product you track separately.

If you have not yet set up usage event tracking, refer to the API reference to get started. Usage events are sent to Startdeliver programmatically from your product.

***

#### Viewing product health

Once products are configured and usage data is flowing, health appears in three places:

**Customer profile header** — a tile per product showing Good / Fair / Poor with a colour indicator. The tile also shows a breakdown by product as coloured tags.

**Customer profile → AI Health Assessment** — product usage is one of the three inputs (alongside experience and support) that the AI reads when producing the overall assessment and recommended actions.

**Lists and filters** — you can filter your customer portfolio by product health. For example: all customers where Core Features health is Poor, sorted by ARR.

***

#### Common setups

**Core product — daily engagement tool** Goal type: Unique days. Target: Fair = 10 days in a rolling month, Good = 20 days. User-based calculation with 60% of users needed for the customer to be Fair.

**Add-on feature — usage volume tool** Goal type: Usage count. Target: Fair = 5 events, Good = 20 events. Customer-based calculation. Excluded from average health so it doesn't drag down the core score while adoption is still ramping.

**Support ticket tracker — no news is good news** Goal type: Usage count with No news is good news enabled. Zero tickets = Good. One or more = Fair or Poor depending on volume.

**Seat utilization — breadth matters** Goal type: Unique quota. Track that a meaningful percentage of licensed users are actually active each month. Fair = 50% of users seen, Good = 80%.


# Experience Health

Experience health is the voice-of-customer signal into your health assessment.

<figure><img src="/files/YpcX8ojcVMX3lgLvY3xf" alt=""><figcaption></figcaption></figure>

### Experience health

**Where to find it:** Settings → Health rules → Feedback section **Who can access it:** Admins only to configure. All team members see results on customer profiles.

***

#### What it is

Experience health measures how your customers feel about your product and service — not what they do, but what they report. It is the voice-of-customer signal in the health model, sitting alongside product usage and support as one of the three inputs the AI reads when assessing every customer.

On the customer profile it appears as the Feedback tile, showing a Good / Fair / Poor status, when the last survey response came in, and how that has trended over time.

***

#### How it works

You connect your survey tool to Startdeliver. From that point, all feedback flows in automatically — every response, from every customer, collected and assessed without manual work from your team.

Startdeliver doesn't just store the responses. The AI reads them as part of the continuous health assessment for each customer, alongside usage and support signals. A single poor survey response won't necessarily tank a customer's overall assessment, but a pattern of negative feedback across multiple respondents is a signal the AI will surface and act on. Equally, consistently strong feedback from engaged users is a signal the AI can identify as a potential reference or advocate opportunity.

The result is that your team doesn't need to manually review survey dashboards to find the risks or the advocates — Startdeliver does it automatically and tells you where to focus.

***

#### Data sources

Experience health is fed by your survey integrations. Startdeliver connects to the tools your team already uses to collect customer feedback:

* Typeform
* Pendo
* Netigate
* SurveyMonkey
* HubSpot Feedback Surveys

Survey responses are matched to customers automatically. Each response contributes to that customer's experience health and feeds the AI assessment.

If you are not yet running customer surveys, the Feedback tile will show no data. Experience health only scores customers with at least one survey response within the configured window.

→ See \[Integrations & Your Stack] for how to connect your survey tool.

***

#### Configuration

Experience health has one setting in Startdeliver.

**Months to include feedback** The rolling window of survey responses used when calculating health. Responses older than this window are still visible on the customer profile but do not affect the health score.

The demo account uses 6 months. Set this to match how frequently you survey customers — if you run quarterly surveys, 4–6 months is a reasonable window. If you survey more frequently, a shorter window keeps the score more current.

To configure: go to Settings → Health rules → Feedback section and set the number of months.

***

#### What CSMs see

On the customer profile the Feedback tile shows:

**Status** — Good, Fair, or Poor, colour-coded.

**Context** — "to our surveys" — a reminder of what the signal is measuring.

**Last survey** — when the most recent response came in. If this date is getting old, it may be time to trigger a new survey. A customer who hasn't responded in several months is an unknown, not a healthy one.

The Feedback signal is one of the three inputs the AI Health Assessment reads continuously. A customer with Poor feedback but Good usage and Good support will have that tension reflected in the AI's plain-language summary and recommended next actions — because a customer who uses the product actively but is telling you through surveys that they're unhappy is sending you a clear message that needs a response.

***

#### What the AI does with feedback

The AI Assessment reads experience health as a behavioural signal, not just a score. Two patterns it flags specifically:

**Churn risk signal** — a customer with consistently poor feedback, or a sudden drop in sentiment, is flagged as a risk even if usage looks healthy on the surface. Poor survey responses are often the earliest signal of a customer who is about to leave. The AI surfaces this and recommends proactive outreach before it becomes a formal churn conversation.

**Reference and advocate signal** — a customer with strong, consistent positive feedback across multiple respondents is identified as a potential reference customer or advocate. These are accounts worth investing in — the kind of customers who will go on record for a case study, join a reference call, or become a champion in their network. The AI flags them so your team can act on the opportunity, not just file the good news.

***

#### Viewing feedback detail

The Feedback tile on the customer profile links through to the full response history for that customer — individual survey responses, scores, and when they were submitted. CSMs can use this to understand the context behind the health status before reaching out.

***

#### Common scenarios

**Customer has Good usage but Poor feedback** One of the most important combinations to catch — the customer is active but unhappy. The AI Assessment will surface this tension directly. The recommended action is typically a proactive outreach to understand what's driving the negative sentiment before it becomes a churn conversation.

**Strong feedback across multiple contacts** The AI identifies this customer as a potential reference or advocate. A good moment for your CSM to have a conversation about a case study, a reference call, or a deeper partnership.

**No feedback data on a customer** The Feedback tile shows no status. The customer has never responded to a survey or their responses are outside the configured window. An unknown is not the same as healthy — consider triggering a survey or flagging them for a check-in call.

**Feedback score is old** Last survey shows a date several months ago. The score may no longer reflect the current relationship. A new survey or a direct conversation is the right next step.


# Support Health

Support health measures the state of your customers' support relationship.

<figure><img src="/files/16fDLm07J0lGXRzL6k5l" alt=""><figcaption></figcaption></figure>

### Support health

**Where to find it:** Settings → Health rules → Support section **Who can access it:** Admins only to configure. All team members see results on customer profiles.

***

#### What it is

Support health measures the state of your customers' support relationship — open tickets, delayed tickets, and resolved ticket history. It is the third signal in the health model, sitting alongside product usage and experience as one of the three inputs the AI reads when assessing every customer.

On the customer profile it appears as the Support tile, showing a Good / Fair / Poor status, a count of open and delayed tickets, and closed ticket history.

***

#### How it works

You connect your support or issue tracking tool to Startdeliver. From that point, all ticket data flows in automatically — every ticket, from every customer, tracked and assessed without manual work from your team.

The integration is bi-directional. Startdeliver doesn't just read ticket data from your support tool — your team can also act from within Startdeliver, and updates sync back. This means your CSMs have full visibility of the support relationship without needing to switch between tools, and your support team's work is reflected in the customer health picture in real time.

***

#### Data sources

Support health is fed by your support and issue tracking integrations. Startdeliver connects to:

* Intercom
* Zendesk
* Freshdesk
* Linear

Tickets are matched to customers automatically. Each ticket's status, age, and resolution time contributes to that customer's support health and feeds the AI assessment.

→ See \[Integrations & Your Stack] for how to connect your support tool.

***

#### Configuration

Support health has two settings in Startdeliver, both in Settings → Health rules → Support section.

**Days until ticket is overdue** The number of days a ticket can remain open before it is considered delayed. The demo account uses 5 days. Set this to match your team's support SLA — if your standard response time is 2 business days, set it to 2 or 3.

**Months to include delayed but resolved tickets** Tickets that were delayed but have since been resolved still matter. This setting controls how far back Startdeliver looks when factoring resolved-but-late tickets into the health score. A customer who had 5 overdue tickets last month that are now closed is not in the same position as one who has never had a delayed ticket — this setting makes sure that history is reflected.

***

#### What CSMs see

On the customer profile the Support tile shows:

**Status** — Good, Fair, or Poor, color-coded.

**Open and delayed** — the count of tickets currently open and how many of those are past the overdue threshold. A delayed ticket is a visible problem that needs attention.

**Closed tickets** — the recent resolved ticket count, giving context on support volume.

The tile subtitle "from our team" frames the signal clearly — this is your team's responsiveness and the customer's support burden, not a product usage metric.

***

#### What the AI does with support data

The AI Assessment reads support health as a relationship signal. Two patterns it flags specifically:

**Escalation risk** — a customer with multiple open or delayed tickets, particularly if combined with poor experience health or declining usage, is flagged as a risk account. Unresolved support issues are one of the clearest early signals of a customer losing confidence. The AI surfaces this and recommends action before the customer raises it themselves.

**Silent but struggling** — a customer who has stopped logging support tickets but whose usage is declining may have given up on getting help rather than actually resolved their issues. The AI can read this pattern across the combined signals and flag it, rather than treating the absence of tickets as a positive sign.

***

#### Bi-directional sync

The support integration works both ways. Your CSM can see ticket status, history, and details directly on the customer profile without leaving Startdeliver. When your support team updates a ticket in Intercom, Zendesk, Freshdesk, or Linear, the change reflects in Startdeliver automatically.

This matters for a few reasons. First, CSMs are always working with current information — not a snapshot from yesterday's sync. Second, when the AI makes an assessment that references a delayed ticket, the underlying data is live. Third, CSMs can take action on support issues from the customer profile without needing access to the support tool directly.

***

#### Common scenarios

**Customer has delayed tickets and Poor support health** The AI will surface this in the assessment and likely recommend a direct outreach from the CSM — not from the support team, but from the relationship owner. A CSM reaching out to acknowledge an ongoing support issue signals a level of care that a ticket response alone doesn't.

**High ticket volume but all resolved on time** Support health may still be Good despite high volume, if tickets are being resolved within the SLA window. The AI reads this as a healthy support relationship — the customer is engaged, getting answers, and not being left waiting.

**No tickets from a customer who was previously active** Worth investigating. Either things are going very well, or the customer has stopped reaching out because they've stopped expecting a good response. The AI will flag this pattern when it appears alongside other declining signals.

**Ticket delayed for a key account** Even a single delayed ticket on a high-ARR customer is worth the CSM knowing about. Use lists filtered by support health and ARR together to make sure high-value accounts with open issues are always visible.


# MRR & ARR

Revenue is the outcome of great Customer Success. Track ARR, MRR, and NRR alongside the health signals and team activity driving them.

<figure><img src="/files/UM8Yun7WXK0exTJRN9yT" alt=""><figcaption></figcaption></figure>

### MRR & ARR

**Where to find it:** Customer profile header · Impact dashboards **Who can access it:** All team members

***

#### What it is

MRR (Monthly Recurring Revenue) and ARR (Annual Recurring Revenue) are pulled into Startdeliver from your subscription management, billing, or CRM tools. Startdeliver is not the source of truth for this data — it reads from wherever your business already manages revenue — but it surfaces it in context alongside health signals, and aggregates it into dashboards your CS team can use to track portfolio performance and revenue movement.

***

#### Data sources

Revenue data flows in from your existing tools via integration. Common sources:

**Subscription and billing tools**

* Stripe
* Chargebee
* Younium

**CRM**

* Salesforce
* HubSpot

**Other** Some teams pipe revenue data in from their own SaaS product's admin tools or via the API where a native integration doesn't exist.

Startdeliver reads the data as it exists in the source. If your ARR figure changes in Stripe, it updates in Startdeliver. Your revenue team continues to own and manage the data in the system of record — Startdeliver shows it where your CS team needs to see it.

→ See [Integrations & Your Stack](/integrations-and-your-stack/what-connects-to-startdeliver) for how to connect your billing or CRM tool.

***

#### On the customer profile

ARR is shown in the customer profile header as a standard metric tile. It gives the CSM immediate context on the account value without needing to look it up elsewhere.

<figure><img src="/files/AskJrtdBKRYWeZV1VWgm" alt=""><figcaption></figcaption></figure>

The header also shows supporting revenue context where available — renewal date, seats, and seat utilisation. In the demo account for example: ARR 103,230 · Renews 2026-03-01 · 29 seen users of 31 seats. A CSM can see at a glance what the account is worth, when it renews, and whether the customer is using what they're paying for.

<figure><img src="/files/DWGagDrLaVxnZQl1LEDs" alt="" width="375"><figcaption></figcaption></figure>

***

#### In dashboards and reports

Aggregated revenue data powers two key dashboards in the Impact section.

**ARR and MRR movement dashboard** Shows how your revenue base is moving over time — new ARR, expansion, contraction, churn, and net movement. Gives CS leadership a clear picture of where revenue is growing and where it is eroding, tied to the customer relationships your team manages.

<figure><img src="/files/jmQrLu8MVjwQJKYraJ40" alt=""><figcaption></figcaption></figure>

**NRR dashboard** Net Revenue Retention — the percentage of revenue retained from your existing customer base after expansion, contraction, and churn. NRR is one of the core metrics CS teams are accountable for. The dashboard shows it at the portfolio level and lets you drill into the cohorts and accounts driving the number in either direction.

<figure><img src="/files/UxnFm7dOjyfKkoOCJse2" alt=""><figcaption></figcaption></figure>

These dashboards are built on the revenue data flowing in from your integrations, combined with customer health and lifecycle data already in Startdeliver. The result is revenue reporting that is connected to the CS work your team is doing — not a separate finance view that exists independently of customer context.

→ See [Dashboards & Reports](/dashboards-and-reports/impact-dashboard-templates) for how to build and configure Impact dashboards.

***

#### Common scenarios

**Renewal coming up on a high-ARR account** ARR and renewal date are both visible in the customer list. Create a Renewals list filtered by upcoming renewal date with ARR as a visible column — your team always knows what's coming and what's at stake.

**Seat utilisation below threshold** A customer with 10 of 50 seats active is both a churn risk and an expansion blocker. The seats data next to ARR on the profile makes this visible immediately, without pulling a usage report separately.

**NRR dropping in a specific cohort** The NRR dashboard lets you identify which segments, lifecycle stages, or CSM portfolios are contributing most to revenue erosion. A useful starting point for a CS team trying to understand where to focus retention effort.


# AI health assessment

Every customer assessed automatically. No manual scoring. No gut feel. Just a current, accurate read on every account — with recommended next steps.

***

<figure><img src="/files/U1psTyJjsF00wDRKjOBw" alt=""><figcaption></figcaption></figure>

### AI Assessments

**Where to find it:** Every customer profile → Assessment panel · Settings → AI **Who can access it:** All team members

***

#### What it is

AI Assessments is the intelligence engine at the core of Startdeliver. It reads all available context for every customer — product usage, experience feedback, support activity, relationship engagement, revenue data, and more — and produces a plain-language assessment of where each customer stands and what your team should do next.

The assessment runs continuously and automatically. It does not need to be triggered. It does not require a CSM to fill in a form. When new data comes in — a survey response, a delayed ticket, a drop in usage, a week of silence — the assessment updates.

***

#### What the assessment produces

On every customer profile, the Assessment panel shows:

**Status** — a plain-language verdict on the customer's current state. Not a number. Not a colour alone. A label that means something: Strongly Thriving, Actively Engaged, Neutral, Needs Attention, At Risk.

**Summary** — one or two sentences describing what is driving the status. What the AI actually found, stated plainly. "Strong engagement with deep adoption, proactive communication, and expansion signals." Or: "Usage declining across core features, last survey response poor, no CSM contact in 6 weeks."

**Trend** — how the assessment has moved over the past weeks and months. Whether things are improving, holding steady, or deteriorating.

**Take Action** — a recommended next step tied specifically to what the AI found for this customer. Not a generic playbook item — a specific, contextual recommendation.

**See full analysis** — the complete breakdown of every signal the AI read, the data behind each one, and the reasoning behind the assessment.

<figure><img src="/files/Lh9ovGCLhctVimZ8liC0" alt=""><figcaption></figcaption></figure>

***

#### What the AI looks for

The AI reads the full picture of the customer relationship. Key signals include:

**Product engagement** — are users active? Is adoption deepening or narrowing? Are the right users using the right features?

**Customer sentiment** — what are survey responses telling you? Is sentiment improving or declining? Are there signals of an advocate or an early warning of churn?

**Support health** — are there open or delayed tickets? Is the customer getting timely help or quietly struggling?

**Relationship activity** — when did your team last meaningfully engage? Is the customer active in Shared Space? Are emails and messages flowing or has communication gone quiet?

**Revenue context** — what is the account worth? When does it renew? Is seat utilisation growing or shrinking?

The AI does not treat these signals as separate scores to average. It reads them together. A customer with strong usage but declining sentiment and a two-month communication gap is a specific situation — the AI identifies the pattern and tells your team what it means.

***

#### Flags the AI raises

Beyond the general assessment, the AI identifies specific patterns worth flagging:

**Churn risk** — a customer showing early warning signs: declining usage, poor feedback, unresolved support issues, or communication that has gone quiet. Surfaced proactively so your team can act before the customer raises it.

**Expansion opportunity** — a customer with strong adoption, positive sentiment, and growing usage who may be ready for an upgrade, an additional product, or a wider rollout.

**Reference and advocate** — a customer with consistently strong feedback across multiple contacts. Worth a conversation about a case study, reference call, or partnership.

**Silent customer** — a customer who has stopped engaging across all channels. Not necessarily churning, but worth attention before the silence becomes a decision.

***

#### You are in control

The assessment is powerful out of the box, but it is designed to work the way your business works — not the other way around.

Through AI instructions in Settings → AI you control:

**Your instructions** — give the AI specific guidance about your business, your customers, and what matters to your CS motion. The AI applies this context to every assessment it runs.

**Team access** — choose which team members can view and use assessments.

**Customer scope** — select which customers get assessed. Useful if you are rolling out AI features progressively or have customer segments that require different treatment.

**Interaction settings** — fine-tune which interactions are included in the context, and create custom interaction types specific to your business.


# Customer overview

The Customers view is a key screen in Startdeliver.

### Customer overview

<figure><img src="/files/bYUGYdAwvdKLanfjYRsh" alt=""><figcaption></figcaption></figure>

**Where to find it:** Customers in the left navigation **Who can access it:** All team members

***

#### The customer portfolio

The Customers view is the default home screen in Startdeliver. It shows every customer your team manages in one place — with AI Health Assessment status, assigned team members, lifecycle stage, renewal date, ARR, and any custom fields your team has configured visible at a glance.

This is where CSMs start their day: reviewing what's changed, spotting at-risk accounts, and picking up where they left off.

***

#### Lists

The portfolio is organized into lists. Each list is a saved view with its own filters, columns, and widgets. You switch between lists using the tabs at the top of the Customers view.

Every team member sees the same lists but a list filtered by "Current signed in" will show each CSM only their own customers — one list, personalized for everyone.

Common lists teams set up out of the box: My Portfolio, Onboarding, Churn Risks, Expansions, Renewals, Success Plans. You can create as many lists as you need and share them across the team.

→ See [Lists & filters](/platform-settings/lists-and-filters) for how to build, customize, and share lists.

***

#### The customer profile

Opening any customer takes you to their profile. The profile has three main areas.

From the customer profile you can also send one-off emails to users and external recipients without leaving Startdeliver. → [Email](/managing-customers/sending-emails)

<figure><img src="/files/U1psTyJjsF00wDRKjOBw" alt=""><figcaption></figcaption></figure>

**The top bar** shows the customer name and logo, assigned team members, the current lifecycle status (Onboarding, Adoption, Engagement, etc.), and — if the customer is part of a group — a link to the parent account.

**The assessment panel** shows the current AI Health Assessment — the status label, the plain-language summary, the trend line over time, and a Take Action button with recommended next steps. This panel updates automatically as new data comes in.

**The metric tiles** below the assessment show ARR, Usage health, Feedback health, Support health, and any additional fields your admin has configured — for example customer tier, payment status, or a product-specific KPI. Tiles are colour-coded based on rules your admin sets.

***

#### Account hierarchy

Startdeliver supports parent and child accounts. If a customer is part of a larger group — a holding company, a parent organization, or an enterprise account with multiple subsidiaries — you can link them.

<figure><img src="/files/imOIoR8RLgK9vYWQJvBU" alt=""><figcaption></figcaption></figure>

Child accounts appear as independent customers in the portfolio with their own profiles, health scores, and assigned CSMs. The parent account links to all children, giving a consolidated view of the group.

This is useful for enterprise customers where different business units have separate contracts but need to be managed as a single relationship at the account level.

***

#### Creating a customer

To add a new customer, click + Create new at the top of the Customers view. Enter the customer name and any required fields your admin has configured. The customer immediately appears in the portfolio and is ready for a CSM to be assigned and a project to be launched.

Customers can also be created in bulk via CSV import (Settings → Import) or automatically via integrations when a new account is created in your CRM or billing system.

***

#### Assigning a team member

Each customer can have one or more team members assigned. Assignment controls which customers appear in a CSM's personal list view and determines the scope of permission rules if your admin has configured assignment-based access.

To assign: open the customer profile, click the team member avatars in the top bar, and select from the team.

{% embed url="<https://www.loom.com/share/b43cb8d68e8c4a79ac9d67db851a2e08>" %}


# Customer users & stakeholders

Every customer has people associated with them in Startdeliver.

### Customer users & stakeholders

**Where to find it:** Customer profile → Users & Stakeholders tab **Who can access it:** All team members

***

#### People on the customer side

Every customer has people associated with them in Startdeliver. The categories you use to organize them are fully flexible — most teams mirror whatever structure already exists in their own SaaS product or CRM, so the setup feels familiar and stays in sync.

In practice, common groupings look something like: decision makers who control renewal and expansion, super users who drive internal adoption, admins who manage configuration, and regular end users. But the names and structure are yours to define. If your product distinguishes between Enterprise Admins and Workspace Members, you set it up that way. If your CRM tracks by region or business unit, you can reflect that too.

As AI becomes more embedded in how customers use software, the people side is expanding beyond humans. Agents, MCP users, and other non-human actors are increasingly part of what you track and manage. Startdeliver is built to accommodate this — you can define and track any user type that matters to your customer relationships, whether that's a person or an automated system.

***

#### The Users & Stakeholders tab

The tab shows everyone associated with the customer, organised into four views:

<figure><img src="/files/tcoBaS1m0J0XaRf5PwMG" alt=""><figcaption></figcaption></figure>

**Stakeholders** — the people your team has flagged as relationship-critical. These are the contacts your CSM manages actively.

**All users** — the full list of people from the customer organization in your product. Pulled in via integration (CRM, product analytics, or your own system) or added manually.

**Non-users** — people added to the customer in Startdeliver who don't have a product seat. Useful for tracking contacts like procurement leads or legal who matter to the relationship but don't use the product.

**Has left** — people who have been marked as inactive or who have left the customer organization. Kept for historical record.

Each person shows their last active date, last seen in product, usage health score, and email. These signals tell a CSM at a glance who is engaged and who has gone quiet.

***

#### Stakeholders

Stakeholders is one way to flag the people in the relationship that need closest attention — but you define what that means for your team. The label itself is an example. Your admin can configure the role types that fit your business: Champion, Decision Maker, Technical Lead, Executive Sponsor, or whatever reflects how you actually manage customer relationships.

Stakeholders appear at the top of the tab and are the people Startdeliver — and Jecta — factor into relationship health. Things like whether a key contact has gone silent or whether an executive sponsor hasn't logged in recently.

To mark someone as a stakeholder: click the person's row and toggle their stakeholder status. You can add a role to give your team context on who this person is and why they matter.

***

#### Adding users

Users can be added manually or synced automatically via integration. If your CRM, billing system, or product analytics tool is connected, Startdeliver will pull in users as they are created there.

To add manually: click Add user at the top of the Users & Stakeholders tab, enter their name and email, and save.

Users must have an email address registered before they can be invited to Shared Space or assigned to a shared project.

The email address is also what Startdeliver uses when you send email to that user from a customer profile or automation. → [Email](/managing-customers/sending-emails)

***

#### Adding to Shared Space

Once a user is on the customer record they can be invited to any shared project or given access to the customer's Shared Space. See [Setting up Shared Space](/managing-customers/shared-space/setting-up-shared-space) for how this works.


# Ongoing - Your actions

Where CSMs run their day. Every task, project, conversation, meeting, and goal — across your entire portfolio — in one place.

**Where to find it:** Ongoing in the left navigation **Who can access it:** All team members

***

<figure><img src="/files/6l9lxHwH3diIrAKlL4d2" alt=""><figcaption></figcaption></figure>

**What it is**

Ongoing is the operational home of Startdeliver. While the Customers view gives you the portfolio picture and the customer profile gives you the account detail, Ongoing is where your team actually works — managing what needs to happen today, this week, and across all their active customers simultaneously.

A CSM who starts their day in Ongoing sees everything that needs their attention: overdue tasks, unread customer messages, upcoming meetings, active projects, and goals that are approaching their deadline. Nothing requires switching between customers or digging through profiles — it's all surfaced in one view.

***

**The six tabs**

**My Task List** Every task assigned to you, across all customers, in one list. Filter by Today, This week, 30 days, All open, Delegated, Shared, or Completed. Switch between list and board view. Each task shows which customer it belongs to, which project it's part of, the due date, and priority. This is where most CSMs start their day — work through what's due today, then look ahead at the week.

<figure><img src="/files/3EnBOUCkFcInXYfb7lh9" alt=""><figcaption></figcaption></figure>

**Projects** All active projects across your portfolio in one view. A Gantt-style timeline shows where each project sits against its deadline. Status widgets at the top give an instant read across the portfolio: how many projects are Live, In setup, overdue, or completed. Filter by project type — Onboarding, Success Plan, Renewals — to see what's running where. If a project is overdue, it shows here before it shows up in a customer's profile.

<figure><img src="/files/T1XCToIiTdDrNmx1yF5z" alt=""><figcaption></figcaption></figure>

**Conversations** All customer conversations across all your projects and tasks, organized into Unread, Recent, Shared, and Sent. Unread shows messages from customers or teammates that need a response. Shared shows conversations happening in Shared Space — comments and messages from your customers. This means CSMs never miss a customer reply by having to remember to check individual project pages.

**Calendar** A weekly view of every meeting synced from your connected Gmail or Outlook. Meetings are linked to the customers they're associated with, so you see your week in customer context — not just a list of calendar events. Click any meeting to open the customer it belongs to.

<figure><img src="/files/naVDPRZ2zIrGn1Q813vA" alt=""><figcaption></figcaption></figure>

**Project Activity** A live activity feed of everything happening across the projects you're involved in — task completions, comments, priority changes, new assignments, and more. Useful for staying across what your team is doing without having to check each project individually. Particularly valuable for CS managers who need portfolio-wide visibility without opening every account.

**Goals** All customer goals across your portfolio in one view. Status widgets show Live, In setup, Awaiting sign off, Completed, and Canceled. Each goal shows the customer it belongs to, the due date, and linked tasks. A goal approaching its deadline with no tasks linked is an immediate signal something needs attention. This view makes it easy to see which customers are on track toward their business outcomes and which ones need a conversation.

***

**How CSMs use Ongoing day to day**

**Morning: start with My Task List** Filter to Today. Work through what's due. Check Conversations for any unread customer messages that came in overnight — especially anything from Shared Space where customers may have replied to a project comment.

**During the week: track projects in Projects** Use the Overdue filter to catch any projects slipping behind. Check Project Activity for anything significant happening across the team's accounts. Use the Gantt view to sense-check renewal and onboarding timelines.

**Before customer calls: check Calendar** The calendar shows upcoming meetings linked to customers. Click through to the customer profile before the call to get context — assessment status, recent activity, open tasks, goals progress.

**End of week: review Goals** Check which customer goals are Live and approaching their deadline. Any goal without linked tasks or with no recent progress is worth a proactive outreach or a note to the next call agenda.

***

**Ongoing vs. the customer profile**

The customer profile gives you the deep view of one account. Ongoing gives you the wide view across all accounts. CSMs move between the two constantly — Ongoing surfaces what needs attention, the customer profile gives the context to act on it.


# Projects

Projects are structured sets of tasks you run on a customer — onboarding, problem resolution, upgrades, or any recurring workflow.

**Customer → Projects tab** · Available to Main and Admin types · Overview of all projects: Ongoing

Projects are structured sets of tasks you run on a customer — onboarding, problem resolution, upgrades, or any recurring workflow. Each project tracks task progress, conversations, files, and impact in one place.

## Project templates

Templates let you standardize recurring project types so you don't rebuild the same task list every time. Set up a template once, then launch it on any customer in seconds.

Common templates to create:

* Onboarding
* Problem resolution
* Upgrade / expansion
* Off-boarding

Each template can include:

* **Due date** — how many days to complete the project from launch
* **Tasks** — the full task list with snooze days (when each task becomes active)
* **Automations** — trigger a follow-on project automatically when this one completes
* **Shared setting** — whether the project is shared with the customer by default

To create a template: go to **Settings → Templates**.

<figure><img src="/files/qECqx2qk8HC314GLRT7j" alt=""><figcaption></figcaption></figure>

## Creating a project

{% embed url="<https://www.loom.com/share/42df7980036a46488cdc93d12427917d>" %}

### On a single customer

1. Open the customer record
2. Go to the **Projects** tab
3. Click **New project** and select a template or start from scratch
4. Set the project type — Internal or Shared
5. If Shared: set up involved users and launch when ready (see [Shared projects](broken://pages/f574a04241ed246df8d0847792fc23da9f38e081))

### Across multiple customers at once

1. Go to your customer list
2. Select the customers using the checkboxes
3. Click **Multi action → Launch project**
4. Select the template to apply

## Working with a project

Each project has five tabs:

| Tab                   | What it's for                                                                  |
| --------------------- | ------------------------------------------------------------------------------ |
| **Overview**          | Task board — drag tasks between Next action, Doing, and Done                   |
| **Conversation**      | Internal notes (or shared comments if the project is shared with the customer) |
| **Resources & files** | Upload and share files related to the project                                  |
| **Impact**            | Customer usage metrics before and after the project started                    |
| **Setup**             | Edit name, due date, team members, sharing settings, and automations           |

<figure><img src="/files/KvnhR4Lm8jwg3SdN7K70" alt=""><figcaption></figcaption></figure>

<figure><img src="/files/0dA4C7kZYLky4nr05419" alt=""><figcaption></figcaption></figure>

## Completing a project

When all tasks are done, open the project and click **Complete project**. If you want this to happen automatically, enable **Complete with last task** in the template settings — the project closes itself when the final task is marked done.

<figure><img src="/files/AkvvQPG2yIIyS3970M3P" alt=""><figcaption></figcaption></figure>

## Viewing all active projects

Go to **Ongoing** in the left menu to see all active projects across your portfolio in one view. Tasks that belong to a project are tagged with the project name in the customer view so you can always trace them back.

<figure><img src="/files/L1ZYHdRy63YWajEkhx2G" alt=""><figcaption></figcaption></figure>

## Common scenarios

### Standardising onboarding across all new customers

Create an Onboarding template with all required tasks and snooze days set. When a new customer is signed, launch the template from their record. Every onboarding follows the same structure with no manual setup.

### Running the same project across a cohort of customers

Use multi-action to select the relevant customers from a list and launch the same project template across all of them in one step.

### Tracking whether a project actually moved the needle

Check the **Impact** tab after launch. It shows usage metrics compared to before the project started, so you can demonstrate concrete progress to the customer or your own team.


# Customer Goals & Success plans

Set concrete goals with your customers, track progress together, and let the AI connect the dots between what's happening and what they're trying to achieve.

**Where to find it:** Customer profile → Customer Goals tab **Who can access it:** All team members. Shareable with customers via Shared Space.

***

**What it is**

<figure><img src="/files/VDj5UURdWzEsyJCQvogQ" alt=""><figcaption></figcaption></figure>

Customer Goals gives your CS team a structured way to define and track what success looks like for each of your customers — not in generic product terms, but in the specific business outcomes your customers are trying to deliver for their own organizations.

Your customers sell outcomes to their customers. A CRM company sells sales growth. An HR software company sells hiring efficiency or cost reduction. An ERP company sells operational speed. An e-sign company sells faster contract cycles. A recruitment platform sells better hires. Customer Goals captures these outcomes, tracks progress over time, and connects them to the work your team is doing — and the AI reads goal progress as part of every customer assessment.

Goals are shareable with customers directly in Shared Space, making the definition of success explicit and visible to both sides of the relationship.

***

**Types of goals**

**Business goals** Outcomes tied to what your customer is trying to achieve for their own business or their customers. Revenue growth, cost reduction, time savings, efficiency gains — any measurable outcome your product is supposed to help them reach.

**Adoption goals** The product usage milestones that serve as leading indicators of whether the business goal will be reached. Feature activation rates, user adoption, usage frequency, seat utilization — the signals that show your product is being used in the way that drives outcomes.

Both goal types typically coexist on the same customer. A well-defined success plan has a business goal at the top and adoption goals that serve as the milestones toward it. Adoption without a business goal is activity. A business goal without adoption milestones is aspiration. Together they form a success plan.

***

**How progress is tracked**

Goal progress is tracked across multiple dimensions simultaneously:

**Timeline** — goals have a defined timeframe. Progress is tracked against the deadline, giving both your team and the customer a clear sense of whether they're on track.

**Linked projects and tasks** — you attach projects and tasks from Startdeliver directly to a goal. As work gets done — onboarding completed, features activated, training delivered — it counts as progress toward the goal.

**Usage and adoption data** — goals can be linked to actual product usage metrics from your connected analytics tools. If the adoption goal is 80% of users active monthly, Startdeliver reads the live usage data and reflects it in goal progress automatically.

**Milestones** — define specific checkpoints within a goal. Each milestone reached contributes to the overall progress picture.

***

**How the AI uses goals**

Goal progress is one of the signals the AI reads when assessing a customer. But it doesn't treat it as a number — it reads it as context about the outcome your customer is trying to deliver for their own business.

The goal belongs to your customer's customer. A CRM company's CS team uses Startdeliver to track whether their customer — a business using the CRM — is on track to grow sales. An HR software company tracks whether their customer is on track to reduce hiring costs. An ERP company tracks whether their customer is saving time on operational processes. An e-sign company tracks whether their customer is closing contracts faster. The goal is what your customer sold their customer — the business outcome your product is supposed to enable.

The AI connects goal progress to everything else it knows about the account. If a customer's users are showing strong feature adoption, key metrics are moving in the right direction, and there's a business goal linked to this customer — the AI reads these signals together and produces an assessment that reflects trajectory toward that outcome, not just current health.

This produces specific, contextual recommended actions grounded in the customer's actual goal. For example: "This customer's users are showing strong adoption of core CRM features and pipeline activity is growing week over week. This aligns with their business goal of 50% sales growth over 12 months. Suggested action: propose activating the lead module in the next call to further accelerate pipeline and keep them on track toward their goal."

Goal progress also surfaces as a risk signal when customers are falling behind. A customer whose business goal is cost reduction through HR automation, but who has low adoption of the relevant features and no completed onboarding projects, is behind on the outcome they promised their own business. The AI reads that gap and flags it as a risk — even if other health signals look neutral.

***

**Sharing goals with customers**

Goals are visible in Shared Space. When you share a goal with a customer, they see the goal, the timeline, the current progress, and the milestones — all in their Shared Space portal.

<figure><img src="/files/ROhOEw9YizQFlPorHP7a" alt=""><figcaption></figcaption></figure>

This makes success criteria explicit and mutual. Both sides know what the goal is, both sides can see whether it's on track, and the customer can see how the projects and tasks your team is running connect to the outcome they care about.

Shared goals shift the conversation from "here's how your product adoption is going" to "here's how we're tracking toward the business outcome you need to deliver." That's a fundamentally different and more valuable CS relationship.

***

**How to set up a goal**

1. Open the customer profile and go to the Customer Goals tab
2. Click to create a new goal
3. Name it in terms of the customer's business outcome — be specific. "Grow sales pipeline by 50% in 12 months" not "improve sales performance"
4. Set the goal type: Business or Adoption
5. Set the timeline — start date and target date
6. Define milestones if relevant
7. Link projects and tasks from this customer's record that contribute to the goal
8. Link usage metrics if the goal is adoption-related
9. Choose whether to share the goal in Shared Space
10. Save

***

**Common scenarios**

**CRM software customer — sales growth goal** Your customer sells a CRM. Their customer's goal is to grow sales by 50% in 12 months. You set a business goal reflecting this outcome and link it to the onboarding project, sales team training, and pipeline feature activation tasks. As usage data shows increasing pipeline activity and more deals being created, the AI reads this as on-track and suggests activating the lead module to further accelerate progress toward the goal.

**HR software customer — cost reduction goal** Your customer sells HR software. Their customer's goal is to reduce cost-per-hire by 30% over the year. You set a business goal and link it to the recruitment workflow activation project and user adoption milestones. If adoption of the relevant features is lagging six months in, the AI flags this as behind on goals and at risk — even if support health looks fine.

**E-sign customer — contract speed goal** Your customer sells e-sign software. Their customer's goal is to reduce average contract turnaround from 5 days to 1 day. You set the business goal and link it to the template setup project and user training tasks. As turnaround time metrics improve, the AI reads this as positive trajectory and surfaces it in the assessment with a recommended action to showcase the ROI in the next Business Review.

**ERP customer — operational efficiency goal** Your customer sells ERP software. Their customer's goal is to reduce manual data entry time by 40% through automation. You set adoption goals around automation feature usage and link them to the implementation project. Low automation adoption despite completed onboarding is flagged by the AI as a gap between where they are and where they need to be.

**Business Review preparation** Goals give your CSM a concrete basis for every Business Review. Instead of presenting a health score, they present: here's what we committed to, here's where we are against the timeline, here's what the data shows about trajectory, and here's what we're doing next to keep you on track. The goal becomes the structure of the entire conversation.

***


# Shared space


# Setting up shared space

Shared Space is a branded collaboration layer between your team and the customer.

### Setting up Shared Space

**Where to find it:** Customer profile → Shared Space section, or via a shared project **Who can access it:** All team members can manage it. Customers access it via a dedicated URL or embedded portal.

***

#### What Shared Space is

Shared Space is a branded portal your customers log into directly. It is the collaboration layer between your team and the customer — a single place where both sides can see progress, share materials, complete tasks, and communicate, without needing to be on the same call.

<figure><img src="/files/ROhOEw9YizQFlPorHP7a" alt=""><figcaption></figcaption></figure>

Where the rest of Startdeliver is internal — visible only to your team — Shared Space is external. What you put there is what your customer sees.

***

#### What you can share

Shared Space is built around shared projects, but can contain a range of content:

**Tasks and project progress** — customers see the task list, can be assigned to tasks, and can check off their own items. Progress is visible to both sides in real time.

**Documents and files** — upload contracts, presentations, meeting notes, training materials, or any file relevant to the customer relationship. Both sides can upload.

**Comments and conversation** — a threaded conversation attached to the project or to individual tasks. Use @ mentions to notify specific people. Works as an async alternative to email chains.

**Goals and targets** — set success criteria, milestones, or adoption targets that both sides can see and track. Makes the definition of success explicit and shared.

**Reports and metrics** — surface usage data, health trends, or custom KPIs directly in the customer's view. Customers see their own data in context.

***

#### How access works

<figure><img src="/files/K2TPebtnnScYYni8UMJS" alt=""><figcaption></figcaption></figure>

Customers access Shared Space via a dedicated URL — typically something like `customer.to/yourcompanyname`. They log in using their email address: they enter their email, receive a one-time verification code, and get access.

<figure><img src="/files/pmTJDhpVNoJkomUXhipX" alt=""><figcaption></figcaption></figure>

No password setup required. No account to create. The experience is frictionless for the customer.

Only the users you explicitly add to a shared project can access it. Access is per-project and per-user — being added to one shared project does not give access to others.

***

#### Setting up a shared project

1. Open the customer profile and go to the Projects tab
2. Click New project and select a template, or start from scratch
3. Set the project type to Shared
4. Build out the task list and content before inviting the customer
5. Go to Involved users and add the customer users who should have access. Users must have an email address registered on their profile
6. When everything is ready, click Launch project. This is when the customer receives their first notification and gains access

No communication is sent to the customer until Launch is clicked. You can set everything up first and launch when ready.

***

#### Assigning tasks to customers

Once users are added to a shared project, they can be assigned to individual tasks. When a task is assigned after launch, the user receives an email notification automatically.

Customers complete tasks from their own view of the Shared Space — they see the task board, mark tasks done, and can add comments or upload files directly.

***

#### Troubleshooting access

If a customer can't access the Shared Space, check:

* Is the project launched? Customers cannot access it until Launch is clicked
* Is the user added to the project under Involved users?
* Does the email the user is trying to log in with match the email on their user record exactly?
* Is the user marked as active on the customer record?


# Branding your shared space

**Where to find it:** Settings → Views → Shared Space **Who can access it:** Admins only

Shared Space uses your company's branding by default. Admins can customize the appearance to match your brand — or configure a white-label version that reflects the customer's own brand for high-touch accounts.

<figure><img src="/files/OFAnQ4NK4rPuHLtcwcrd" alt=""><figcaption></figcaption></figure>

**What you can configure:**

Logo — your company logo shown in the portal header

Colors — primary color used for buttons, highlights, and accents

Background — header background color or image

Custom domain — instead of `customer.to/yourcompanyname`, point to a subdomain you own, for example `success.yourcompany.com`

To configure: go to Settings → Views → Shared Space and update the branding options. Changes apply across all Shared Spaces for all customers.


# Embedded shared space

Shared Space can be embedded directly inside your customer's own tools — a customer portal, an internal wiki, a support hub, or anywhere that accepts an iframe.

This means your customers never have to navigate to a separate URL. The Shared Space appears as a native part of their existing environment.

**How to embed:**

Go to the shared project or the customer's Shared Space, find the Embed option, and copy the embed code. Paste it into the target page in your customer's tool. The embedded view is fully functional — tasks, comments, files, and all content work the same way as the standalone portal.

Access still works the same way — users verify via email the first time they open it, and only authorised users can see the content.


# Use case: Success Plan


# Use case: Onboarding


# Sending Emails

Send emails to customers and users directly from Startdeliver.

<figure><img src="/files/cNAXXufsx44IGXvLi0QB" alt=""><figcaption></figcaption></figure>

**Where to find it:** Customer profile → Send email | Automations → Add Action → Actions on related items → Send email

**Who can access it:** All team members can send from a customer profile. Admins can add email actions in automations.

## Email

Email lets you send messages to users, team members, or external email addresses directly from Startdeliver. Use it for one-off outreach from a customer profile or for repeatable sends inside an automation.

Emails are sent from a connected mail account or a configured sender address. The available sender options depend on your team's setup.

***

### Sender

Choose who the email is sent from.

<figure><img src="/files/m5a7rt6TPQbmqfKoYCkF" alt=""><figcaption></figcaption></figure>

**My TeamMember** sends from your own connected email address. Use this for direct outreach that should come from you.

**The customer's team member** sends from the team member assigned to the customer at send time. Use this in automations when the message should come from the responsible CSM instead of a shared inbox.

If no team member is assigned, set a fallback sender. That ensures the email still sends.

**Shared addresses** send from a shared inbox such as `info@` or `support@`. Use this for team-wide or transactional communication.

***

### Recipients

The main recipient is filled in by default. You can add more recipients in **TO**, **CC**, and **BCC**.

<figure><img src="/files/cDi5NHN3XJMZIJjNUruj" alt=""><figcaption></figcaption></figure>

Recipients can be:

* customer users
* team members
* plain email addresses

This gives you flexibility for direct customer outreach, internal visibility, or external stakeholders.

***

### Attachments

Attach files directly to the email before sending. This is useful for sharing documents, follow-ups, or supporting material without leaving Startdeliver.

***

### Templates

Load a messaging template to pre-fill the subject and body. This speeds up repetitive sends and keeps communication consistent across the team.

Manage messaging templates in **Settings → Templates**.

→ See [Templates & projects](/platform-settings/templates-and-projects)

***

### Sending from a customer profile

Use customer profile email when you want to send a message in the moment.

Common examples:

* onboarding follow-up
* meeting recap
* renewal outreach

This is best for personal, manual communication tied to a specific customer.

***

### Sending from automations

Use email in an automation when the message should send automatically based on a rule, schedule, or workflow step.

A common setup is to send from **The customer's team member** so the email feels personal even when it is automated.

If you use this option, make sure a fallback sender is configured.

→ See [Automations](/managing-customers/automations)

***

### Related pages

* [Google mail & calendar](/integrations-and-your-stack/google-mail-and-calendar)
* [MS365 mail & calendar](/integrations-and-your-stack/ms365-mail-and-calendar)
* [Automations](/managing-customers/automations)
* [Templates & projects](/platform-settings/templates-and-projects)


# Automations

Automations let you define rules that run actions automatically when something happens in Startdeliver.

**Where to find it:** Settings → Automations | **Who can access it:** Admins only

## Automations

Automations let you define rules that run actions automatically when something happens in Startdeliver. You set a trigger, add optional conditions to narrow when it fires, and choose one or more actions to run. This removes repetitive manual work from your team's day — things like updating customer status, launching a project, sending an email, or notifying a CSM.

<figure><img src="/files/GerlK31kahmGG0fspLcT" alt=""><figcaption></figcaption></figure>

### Key concepts

* **Trigger** — the event that starts the automation. Either a save event (something is updated), a time-based schedule, or a manual run from the customer list.
* **Criteria** — optional filters that must all be true for the automation to fire. Without criteria, the automation runs for every record that matches the trigger.
* **Action** — what happens when the automation fires. You can chain multiple actions in sequence.
* **Item type** — the entity the automation runs against: Customer, User, Project, Task, or Interaction.
* **Test mode** — a safe state where the automation evaluates who it would affect but makes no real changes. Use this before going live.

### The automations list

Go to **Settings → Automations** to see all automations in your account. They are grouped into three sections:

* **Active** — automations that are live and running
* **Running in Test Mode** — automations evaluating against real data but making no changes
* **Drafts** — automations that have been saved but not yet activated
*

```
<figure><img src="/files/xChfKL7II3wIpTrcEGXs" alt=""><figcaption></figcaption></figure>
```

Each row shows the automation name, a short description, the trigger type (**Save** or **Time**), the number of customers or users in scope, the action types configured, and run counts for today and this week. The avatars in the **Latest** column show which records were processed most recently.

Use the search bar at the top to find automations by name, description, or status.

### Creating an automation

Click **Create new automation** in the top-right corner. This opens the automation editor with three sections: **WHEN**, **IF**, and **THEN**.

<figure><img src="/files/CW2oicLLBQJaPxXWJd0Z" alt=""><figcaption></figcaption></figure>

{% stepper %}
{% step %}
**Set up the trigger (WHEN)**

The trigger defines what starts the automation. Click the **Trigger** card to choose one:

* **When a \[item type] is updated (Save)** — fires every time a record of that type is saved. This is the most common trigger.
* **Time-based** — fires on a schedule, for example daily, to evaluate records that match a condition at a set time.
* **Shortcut (Manual)** — the automation does not run automatically. You trigger it manually from the customer list using **More Actions**.

The item type (Customer, User, Project, Task, Interaction) is set when you choose your trigger. It determines which fields are available in the criteria and actions sections.

Click **Advanced Options** on the trigger card to control whether the automation can run multiple times for the same record, and to set a minimum delay between runs.
{% endstep %}

{% step %}
**Add criteria (IF)**

Criteria narrow down when the automation actually fires. Without any criteria, the automation runs for every record matching the trigger.

Click **+ Add Criteria** to add a condition. Common condition types include:

* **Value was changed** — fires only when a specific field changes, optionally from a particular value to another. Useful for status transitions.
* **Matches a filter** — uses standard Startdeliver filter logic to check the current state of a field.

You can add multiple criteria. All criteria must be true for the automation to proceed.
{% endstep %}

{% step %}
**Add actions (THEN)**

Actions are what the automation does when the trigger fires and all criteria pass. Click **+ Add Action** to add one or more actions. Actions run in the order shown — drag and drop to reorder them.

**Actions available for Customers:**

* Update customer (any field, including status, custom fields, and confidence)
* Add comment
* Create task
* Create project
* Delete customer
* Run automation shortcut

**Actions available for Users:**

* Send email — sends an email to the user. Supports TO, CC, and BCC recipients, dynamic sender selection, and cross-customer sends.
* Update user
* Delete user

**General actions (available for all item types):**

* Send notification (to a team member or yourself)
* Send webhook (to an external system)
* Wait (pause for a set number of days before the next action runs)

When an automation runs on a Customer item type, you can also add **actions on related items** — for example, update or send an email to a related user, or trigger an action on a related task.
{% endstep %}

{% step %}
**Configure permissions**

At the bottom of the Setup page you will find **Permission Settings**. This controls whose permission level the automation runs under — either the automation creator's or the user who triggered the update. This matters when field visibility or write access differs by role.
{% endstep %}
{% endstepper %}

### Running an automation manually

Manual automations (Shortcut trigger) must be run from the customer list:

1. Go to **Customers** in the left navigation.
2. Select one or more customers using the checkboxes.
3. Click **More Actions** in the toolbar.
4. Select the automation you want to run.

This method gives you full control over which records the automation applies to.

### Test mode

Before going live, run an automation in test mode to verify it targets the right records without making any real changes.

{% stepper %}
{% step %}
**Open the automation and go to Setup**
{% endstep %}

{% step %}
**Save the automation in test mode rather than activating it**
{% endstep %}

{% step %}
**Let it evaluate**

The **Processed Customers** tab shows who would have been processed and what the result would be.
{% endstep %}

{% step %}
**When you are satisfied, return to Setup and activate the automation**
{% endstep %}
{% endstepper %}

Automations in test mode appear under **Running in Test Mode** in the main list so you can track them separately from live automations.

### Monitoring and history

Open any automation and click the **Overview** tab to see what item type and trigger it uses, who last modified it and when, and a summary of recent activity with links to processed records.

<figure><img src="/files/xChfKL7II3wIpTrcEGXs" alt=""><figcaption></figcaption></figure>

Click **Processed Customers** (or Processed Users, depending on item type) to see the full run log. You can filter by **In Progress**, **Completed**, and **Failed**. Click any individual record to see its detailed execution log.

### Pausing and archiving

At the bottom of the **Setup** tab you will find two options:

* **Pause Automation** — temporarily stops the automation from running. You can resume it at any time.
* **Archive Automation** — permanently removes the automation from the active list. Archived automations do not run for new records. You can view archived automations via the link at the bottom of the main Automations list.

### Send email

**Sender** — Choose Customer's team member to send the email from the team member assigned to the customer. Set a fallback address for cases where no team member is assigned.

**Send as one email** — For multi-action automations, consolidate emails to recipients across different customers into a single send. A warning appears when recipients span multiple customers, both in the editor and at the confirmation step.

→ See [Email](/managing-customers/sending-emails) for sender options, recipients, attachments, and templates.

### Common scenarios

**Automatically launch an onboarding project when a customer enters Onboarding status**

Trigger: **When a Customer is updated.** Criteria: Status value was changed from Any to Onboarding. Action: Create project (using your onboarding project template). This runs for every customer whose status moves to Onboarding, removing the need for a CSM to manually kick off the project.

**Alert the CSM when a stakeholder goes inactive**

Trigger: **Time-based** (runs daily). Criteria: User last login date is more than 30 days ago. Action: Send notification to the customer's assigned CSM. Optionally add a second action to send an email directly to the stakeholder. This keeps the team aware of disengaged contacts without anyone needing to check manually.

**Update customer status when ARR drops to zero**

Trigger: **When a Customer is updated.** Criteria: ARR value was changed to 0. Action: Update customer — set Status to Churned. This ensures the customer record reflects reality the moment data is synced from your billing system, with no manual intervention required.


# Impact: Dashboard Templates

When you create a new Impact view, Startdeliver offers four ready-made templates alongside the option to start from scratch.

**Where to find it:** Impact → More views (top right) → Create new view

**Who can access it:** Any user with access to Impact. Creating and saving a new view may require manager or admin permissions — check with your team lead if you cannot save.

## What templates are

When you create a new Impact view, Startdeliver offers four ready-made templates alongside the option to start from scratch. Each template is a pre-configured dashboard with a set of widgets chosen to answer a specific CS question straight away. You can use a template as-is or customise it after creation just like any other view.

Templates do not share data or settings with each other — each creates an independent view in your account.

<figure><img src="/files/jnBGpJtFlWinMvIGgGJk" alt=""><figcaption></figcaption></figure>

## How to create a view from a template

1. Go to **Impact** in the left navigation.
2. Click **More views** in the top-right of the tab bar to open the dropdown.
3. Click **+ Create new view**.
4. Click the template card you want to use.
5. The dashboard opens immediately as a preview with a confirmation banner. Click **This is fine** to save it, or **Try another** to go back and pick a different template.

<figure><img src="/files/dATz6ODeEpNNkLBWIZyp" alt=""><figcaption></figcaption></figure>

Once saved, the view appears in your tab bar and can be renamed, edited, or deleted like any other view.

***

## Template reference

## Customer overview

Get an overview of your customers. What's the direction of their status, the recurring revenue, the retention, etc.

The Customer overview gives you a portfolio-level snapshot of all your customers in one place. It combines headline KPIs, a full breakdown by lifecycle status, and a health trend chart — covering the three questions CS leaders ask most often: how many customers do we have, where do they sit in the lifecycle, and is the portfolio getting healthier or not?

<figure><img src="/files/pVJ9EvvqxrXxvT88aUG4" alt=""><figcaption></figcaption></figure>

### Row 1

**Customer Segments**

Three widgets side by side:

* **Active Customers** — total active customer count with ARR and a month-over-month comparison
* **Customer Lifecycle** — a multi-KPI panel showing counts for Onboardings, Expansion, Up for renewal, and Cancelled
* **Customers at risk** — count of at-risk customers with ARR and a monthly comparison

### Row 2

**Customers by status**

A table listing every lifecycle status (Doing nothing, New Customer, Onboarding, Adoption, Expansion, Engagement, Restart Customer, Cancelled) with four columns per row: customer count, ARR, change since last month, and percentage of total. A toggle at the bottom of the table switches between **Show numbers**, **Show as ARR**, and **Show as Seats**.

### Row 3

**Usage health changes**

A stacked bar chart showing how overall customer health (Good, Fair, Poor) has shifted across the past 12 months. The same Show numbers / Show as ARR / Show as Seats toggle applies here.

## Health overview

View the customer's health and adoption in your products.

The Health overview breaks down customer health across three signals — usage, support, and feedback — and shows which customers have recently moved between health tiers. It is designed for regular health reviews and helps the team spot emerging risk before it becomes churn.

**Filter:** Team Member

<figure><img src="/files/SFYh3VtqkNhqdCVB1H1N" alt=""><figcaption></figcaption></figure>

### Row 1

**Usage changes + Usage health last 12 months**

A grouped data widget showing the current count of customers in each usage health tier: **Good**, **Fair**, and **Poor**, each with a month-over-month comparison. Below each count, a "Recent" list shows the customers who most recently moved into that tier, along with where they came from (e.g. "from Good 56 days ago") and a **Show more events** link.

Below the grouped widget, a **Usage health last 12 months** stacked bar chart shows the month-by-month split across Good, Fair, and Poor over the past year. Toggle between **Show numbers**, **Show as ARR**, and **Show as Seats**.

### Row 2

**Support changes + Support health last 12 months**

The same layout as Row 1, applied to support health. Shows current Good/Fair/Poor counts, recent movers, and a 12-month support health trend chart.

### Row 3

**Feedback changes + Feedback health last 12 months**

The same layout as Row 1, applied to feedback health. Shows current Good/Fair/Poor counts, recent movers, and a 12-month feedback health trend chart.

## ARR/MRR Movement Dashboard

Track your ARR/MRR movement trends with detailed expansion and contraction breakdowns. Monitor customer revenue growth and identify patterns in revenue changes.

<figure><img src="/files/jmQrLu8MVjwQJKYraJ40" alt=""><figcaption></figcaption></figure>

The ARR/MRR Movement Dashboard gives a month-by-month breakdown of how your recurring revenue is moving. It separates expansion, contraction, and churn so you can understand not just whether ARR is growing, but why.

**Filter:** Team Member

### Row 1

**ARR/MRR Movement**

A line chart showing **Net ARR Retention** as a percentage over time, with a **Month / Quarter / Year** toggle in the top-right corner to change the time granularity.

Below the chart, a detailed data table shows the following metrics for each period:

* **Starting ARR** — ARR at the start of the period
* **Expansion ARR** — revenue added from upsells or cross-sells
* **Contraction ARR** — revenue lost from downgrades
* **Churn ARR** — revenue lost from cancellations
* **Net Change** — net movement in ARR for the period
* **Net ARR Retention** — retention rate as a percentage

## Team Overview

Get a customer overview on a per team member, or team, basis.

The Team Overview gives CS leaders a side-by-side comparison of every team member's portfolio. Each row represents one CSM and shows their customer count, ARR, health distribution, open priorities, and recent activity — making it easy to spot imbalances in workload or portfolio health across the team.

<figure><img src="/files/GSU7wYoAmeOxUiNwCWhc" alt=""><figcaption></figcaption></figure>

**Filter:** Team

### Row 1

**Total row**

A summary row across all CSMs showing combined totals: total customers, total ARR, combined usage health (Good/Fair/Poor), aggregated priority actions, and team-wide activity in the last 30 days.

### Rows 2+

**One row per team member**

Each CSM gets a row showing:

* **Name and avatar** with their customer count and ARR
* **Usage health** — Good / Fair / Poor counts for their portfolio
* **Priority actions** — Onboardings, At Risk (with ARR value), Expanding, Open Prio Tasks
* **Activity last 30 days** — Meetings, Emails, Tasks closed, Projects closed

Clicking a row opens a drilldown list of that CSM's customers.

The **Team** filter at the top lets you narrow the view to a specific team, so team leads can focus on their own group without seeing other teams' data.

***

## Common scenarios

### Weekly portfolio health review

A CS team lead opens the **Health overview** at the start of each week to see which customers have dropped from Good to Fair or Fair to Poor in the past seven days. The "Recent" lists under each tier show exactly who moved and when, so the lead can assign follow-up actions before the next team standup.

### Board reporting on revenue retention

A CS director uses the **ARR/MRR Movement Dashboard** before a board meeting. Switching to the Quarter view in the chart gives a clean picture of Net ARR Retention over the past three quarters. The table beneath shows exactly how much came from expansion versus how much was lost to churn, giving the data needed to tell the full revenue story.

### Balancing team workload

A CS manager opens the **Team Overview** during a quarterly planning session. Comparing the "At Risk" column across CSMs reveals that one team member has significantly more at-risk customers by ARR than others. The manager uses this to reassign two accounts before the risk escalates, and checks the Activity columns to ensure workload is sustainable across the team.


# Impact: Custom Widgets

**Where to find it:** Impact → More views (top right) → Create new view → Empty view → Add new row → Create a custom widget

**Who can access it:** Any user with access to Impact. Saving a new dashboard may require manager or admin permissions — check with your team lead if you are unable to save.

## What it does

Impact dashboards let you build your own views to track the metrics that matter most to your team. Starting from an empty view, you add rows of widgets, each pulling live data from Startdeliver. The custom widget builder lets you go beyond the pre-built templates and configure exactly what data is shown, how it looks, and what happens when someone clicks into it.

## Key concepts

**Views** are named dashboards that live under the Impact section. Each view can contain multiple rows of widgets.

**Rows** group widgets horizontally across the dashboard. You add a row first, then place widgets inside it.

**Widgets** are the individual data panels inside a row. Each widget has a type (KPI, chart, grouped data, and so on), a data source, and configuration options for filtering, styling, and drilldown.

## How to create a new empty view

<figure><img src="/files/UJhcS2O4yNY2habtwJ1v" alt=""><figcaption></figcaption></figure>

1. Go to **Impact** in the left navigation.
2. Click **More views** in the top-right of the tab bar to open the dropdown.
3. Click **+ Create new view**.
4. On the template picker, select **Empty view** ("Create a new view from scratch").
5. The **Customize Dashboard** editor opens. Enter a name in the **Name** field.
6. Optionally click **Add filter** under **Visible filters** to add dashboard-level filters that apply across all widgets in this view.
7. Click **+ Add new row** in the dashed canvas area to begin adding widgets.

The **Disable wobbling** button (top right of the editor) freezes the drag-to-reorder animation while you work. Click **Done editing** (bottom right) when the dashboard is complete.

## The widget library

Clicking **+ Add new row** opens the **Select a new widget** panel. From here you can browse pre-built widgets by category (All, Customers, Team Member, Charts, Tables, Usage Health), search by name, or click **Create a custom widget** to build one from scratch.

## Creating a custom widget

<figure><img src="/files/Oq2mqpr1mgys4ypO5kzp" alt=""><figcaption></figcaption></figure>

Click **Create a custom widget** to open the **Create widget from scratch** panel.

### Step 1 — Choose your data type

<figure><img src="/files/GruZCxdS4qTZv99JGHQ4" alt=""><figcaption></figcaption></figure>

Use the **"What kind of data do you want to show?"** dropdown to select the entity your widget will count or measure: **Visual**, **Customer**, **User**, **Project**, **Task**, or **Interaction**.

### Step 2 — Choose a base widget type

Once you have selected a data type, the available base widget layouts appear.

The options for **Visual** data are:

| Widget type  | What it shows                                         |
| ------------ | ----------------------------------------------------- |
| Text widget  | A line of plain text for notes, labels, or context    |
| Title widget | A heading used to separate sections and label content |

The options for **Customer** data are:

| Widget type                 | What it shows                                                        |
| --------------------------- | -------------------------------------------------------------------- |
| KPI Widget                  | A single key number with an optional comparison and secondary metric |
| Multiple KPI Widget         | Several KPI numbers shown together in one compact widget             |
| Time graph widget           | Data plotted over time, grouped by a date field                      |
| Multi chart widget          | Two numeric metrics over time, shown as bars and a line              |
| NPS history chart widget    | NPS response volume as bars with NPS score shown as a line           |
| NPS responses widget        | Total NPS response volume for a chosen time period                   |
| NPS groups widget           | NPS responses split into Promoters, Neutrals, and Detractors         |
| Simple NPS score widget     | A single NPS score for a chosen time period                          |
| History chart widget        | A numeric field plotted month by month as a bar chart                |
| Report graph widget         | Value groups shown month by month as stacked or grouped bars         |
| Horizontal bar chart widget | Customer statuses shown as horizontal bars with counts and ARR       |
| Grouped data widget         | Data split into configurable groups with colour-coded counts         |

KPI Widget, Multiple KPI Widget, and Time graph widget are Universal types and available regardless of which data type you select. Click the widget type you want, then click **Save** to open the configuration panel.

### Step 3 — Configure the widget

After selecting a base type, the full configuration panel opens with a live **Preview** at the top that updates as you make changes. The sidebar sections differ by widget type — see the widget type reference below for the full details of each. Click **Save** when done.

<figure><img src="/files/B25XoPgaU1W4CVDMLcyW" alt=""><figcaption></figcaption></figure>

***

## Widget type reference

Each widget type has its own set of configuration sections. Use the descriptions below to understand what each setting controls.

### Text widget

Visual

Adds a line of plain text to your dashboard. Use it to add notes, descriptions, or labels that give context to the widgets around it.

#### Text

* **Text** — the content to display on the dashboard.

### Title widget

Visual

Adds a heading to your dashboard. Use it to separate sections, label groups of widgets, or give your dashboard clear visual structure.

#### Title

* **Title text** — the text to display as the heading.
* **Size** — **Big** for a large heading, **Medium**, or **Small**.
* **Show line below title** — when enabled, a horizontal line is drawn below the title to visually separate it from the content below.

### KPI Widget

Universal

Shows a single large number with an optional comparison and secondary metric. Use it to track one key measure at a glance — such as active customer count, total ARR, or number of open tasks.

<figure><img src="/files/327wSlTbsXX7okgdNwkf" alt=""><figcaption></figcaption></figure>

#### Filtering

* **Filter condition** — defaults to "Empty filter (all items will match)". Click to add conditions, for example only count customers with a specific health score or status. The filter applies to both the main number and the comparison.
* **Current standard filter** — optionally link to a saved filter from your account.

#### Style

* **Widget name** — the label shown at the top of the widget on the dashboard.
* **Icon** — an optional icon shown next to the main number.
* **Icon color** — sets the icon color and its background tint.
* **Bottom text** — a short static label shown below the main number. Use it for context or a unit.

#### Comparison

* **Show comparison** — Yes / No toggle. When enabled, the comparison row appears.
* **Show comparison as** — **Text** for the raw difference, **Percentage** for the absolute percent of total, or **Change percentage** for the percent change between the two periods.
* **Time to compare** — how many intervals back to compare against, for example `3`.
* **Interval** — the time unit to compare by: **Year(s)**, **Month(s)**, **Week(s)**, or **Day(s)**.

#### Secondary number

* **Show secondary number** — Yes / No toggle. Adds a second metric alongside the main KPI, for example ARR next to a customer count.
* **Secondary number field** — the field to calculate from, for example ARR.
* **Secondary number filter** — applies an additional filter that only affects the secondary number, not the main count.
* **Secondary number type** — Sum or Average.
* **Shorten secondary number** — Yes / No. Abbreviates large numbers, for example `1,200,000` → `1.2M`.

#### Drilldown

* **Drilldown fields** — the columns shown when a user clicks the widget to see the underlying records.
* **Drilldown sort field** — which field the list is sorted by when it opens.
* **Drilldown sort order** — ascending or descending.

### Multiple KPI Widget

Universal

Shows several KPI numbers side-by-side in a single compact widget. Each KPI has its own label, primary number, and optional secondary number. Use it when you want to display a handful of related metrics together without using multiple separate tiles — for example, customer count, user count, and task count in one widget.

#### Data

* **KPI items** — a list of the KPIs shown in the widget. Configure each item independently. You can add, remove, and reorder them.
* **+ Add item** — adds another KPI to the widget.

#### Primary number

* **Name** — the label shown below the number.
* **Entity** — which type of data to count: **Customers**, **Users**, **Projects**, **Tasks**, **Interactions**, or **Feedback**.
* **Data display type** — **Count** for total records or **Percentage** for a share of the total.
* **Filter** — narrows which records are counted.
* **Standard filter** — applies a preset system filter, for example active customers only.

#### Secondary number

* **Show secondary number** — Yes / No toggle. Shows a secondary figure alongside the main number.
* **Secondary number entity** — which entity the secondary number is calculated from. This can differ from the primary number.
* **Secondary number field** — which field to aggregate, for example ARR or seat count.
* **Secondary number type** — **Sum** or **Average**.
* **Use same filter as primary** — when enabled, the secondary number inherits the primary filter.
* **Secondary number filter** — an additional filter applied only to the secondary number.
* **Secondary number standard filter** — a preset system filter for the secondary number.

### Time graph widget

Universal

<figure><img src="/files/AEcNaGb2TaodPNnuBbp9" alt=""><figcaption></figcaption></figure>

Plots the count of records over time, grouped by a date field. Useful for tracking trends such as how many customers were created each month, how many tasks were completed per week, or how renewals are spread across the coming months.

#### Filtering

* **Filter condition** — defaults to "Empty filter (all items will match)". Click to add conditions. Note that this widget automatically applies a filter on the date field selected in Data settings.
* **Current standard filter** — optionally link to a saved filter from your account.

#### Data settings

* **Field** — the date field used to group data along the x-axis (e.g. Created at, Renewal date). Click Edit to change it.
* **Interval unit** — the time period for each bar or data point: Day(s), Week(s), Month(s), or Year(s).
* **Number of intervals** — how many intervals to display (default: 12).
* **Show future data** — Yes / No toggle. By default, only past data is shown. Enable this to include future intervals, for example to see upcoming renewals plotted month by month.
* **Graph type** — Bar, Line, or Bubble.

#### Visual settings

* **Name** — the widget title shown on the dashboard.
* **Show labels** — Yes / No toggle. Displays the count value above each bar or data point.
* **Height** — controls how tall the widget renders on the dashboard (in row-height units).
* **Color** — the colour used for the bars or line: Blue, Green, Red, Purple, or Indigo.

#### Drilldown

* **Drilldown fields** — the columns shown when a user clicks a bar or data point to see the underlying records for that time period.
* **Drilldown sort field** — which field the list is sorted by when it opens.

### Multi chart widget

Customer

Displays two metrics side-by-side over time — one as bars and one as a line on the same chart. Use this to compare two related metrics and see if they move together, for example ARR against seat count over the past year.

#### Filtering

* **Filter condition** — defaults to "Empty filter (all items will match)". Click to add conditions — for example, only include customers with a specific status or tag.
* **Current standard filter** — optionally link to a saved filter from your account.

#### Data settings

* **Number of intervals** — how many months of history to display.
* **Bar field** — the numeric field shown as bars, one per month. Click **Edit** to change it.
* **Line field** — the numeric field shown as a line overlaid on the bars. Click **Edit** to change it.

#### Visual settings

* **Bar color** — the color of the bars: **Blue**, **Green**, **Red**, **Purple**, **Indigo**, or **Custom color**.
* **Custom bar color** — only visible when **Custom color** is selected. Pick any color for the bars.
* **Show history bars as gray** — only available with a custom bar color. When enabled, all bars except the most recent are shown in gray, drawing attention to the current period.
* **Line color** — the color of the overlaid line.

#### Drilldown

* **Drilldown fields** — the columns shown when a user clicks a bar to see the underlying records for that month.
* **Drilldown sort field** — which field the list is sorted by when it opens.
* **Drilldown sort order** — ascending or descending.

### NPS history chart widget

Customer

Shows NPS response volume as bars and NPS score as an overlaid line in a single combined chart. Use it to track whether your NPS score is improving over time and whether response volume correlates with score changes.

#### Filtering

* **Filter condition** — defaults to "Empty filter (all items will match)". Click to add conditions — for example, only include responses from a specific customer segment.
* **Current standard filter** — optionally link to a saved filter from your account.

#### Data settings

* **Number of intervals** — how many time periods to display.
* **Interval unit** — the unit for each period: **Day(s)**, **Week(s)**, **Month(s)**, **Quarter(s)**, or **Year(s)**.

#### Visual settings

* **NPS color** — the color of the NPS score line.
* **Responses color** — the color of the bars: **Blue**, **Green**, **Red**, **Purple**, **Indigo**, or **Custom color**.
* **Responses color (bar)** — only visible when **Custom color** is selected. Pick any bar color.
* **Draw number of responses on the bars** — when enabled, the response count is printed on each bar.
* **Hide responses scale** — when enabled, the Y-axis scale for the bars is hidden for a cleaner look.

#### Drilldown

* **Drilldown fields** — the columns shown when a user clicks a bar to see the underlying NPS responses for that period.
* **Drilldown sort field** — which field the list is sorted by when it opens.
* **Drilldown sort order** — ascending or descending.

### NPS responses widget

Customer

Shows the total number of NPS responses received within a chosen time period. Use it for a quick view of response volume — either for a specific window or all time.

#### Data period

* **Show all-time data** — when enabled, the widget counts all responses regardless of date. When disabled, a specific time window is used.
* **Period duration** — how many units back in time the window covers, for example `3`. Only visible when all-time data is off.
* **Period unit** — **Day(s)**, **Week(s)**, **Month(s)**, **Quarter(s)**, or **Year(s)**. Only visible when all-time data is off.

#### Filtering

* **Filter condition** — defaults to "Empty filter (all items will match)". Click to add conditions to narrow which responses are included.
* **Current standard filter** — optionally link to a saved filter from your account.

#### Drilldown

* **Drilldown fields** — the columns shown when a user clicks the widget to see the underlying responses.
* **Drilldown sort field** — which field the list is sorted by when it opens.
* **Drilldown sort order** — ascending or descending.

### NPS groups widget

Customer

Displays NPS responses split into **Promoters**, **Neutrals**, and **Detractors** with a count for each group. Use it to see the balance of your NPS feedback and track whether the share of promoters is growing over time.

#### Data period

* **Show all-time data** — when enabled, the widget counts all responses regardless of date. When disabled, a specific time window is used.
* **Period duration** — how many units back in time the window covers, for example `3`. Only visible when all-time data is off.
* **Period unit** — **Day(s)**, **Week(s)**, **Month(s)**, **Quarter(s)**, or **Year(s)**. Only visible when all-time data is off.

#### Filtering

* **Filter condition** — defaults to "Empty filter (all items will match)". Click to add conditions — for example, only responses from a specific customer segment.
* **Current standard filter** — optionally link to a saved filter from your account.

#### Drilldown

* **Drilldown fields** — the columns shown when a user clicks a group to see the underlying responses.
* **Drilldown sort field** — which field the list is sorted by when it opens.
* **Drilldown sort order** — ascending or descending.

### Simple NPS score widget

Customer

Displays a single large NPS score for a chosen time period. You can also configure dynamic color ranges so the score changes color based on whether it is above or below specific thresholds.

#### Data period

* **Show all-time data** — when enabled, the score is calculated from all responses ever received. When disabled, only responses within a specific window are used.
* **Period duration** — how many units back in time the window covers, for example `3`. Only visible when all-time data is off.
* **Period unit** — **Day(s)**, **Week(s)**, **Month(s)**, **Quarter(s)**, or **Year(s)**. Only visible when all-time data is off.

#### Filtering

* **Filter condition** — defaults to "Empty filter (all items will match)". Click to add conditions to narrow which responses are included in the score calculation.
* **Current standard filter** — optionally link to a saved filter from your account.

#### Styling

* **Default number color** — the color of the NPS score when no dynamic color rules apply.
* **Use dynamic colors** — when enabled, the score color changes based on its value using the thresholds defined below.
* **Range 1 minimum value** — the score must be at or above this value for **Range 1**'s color to apply. Set this as the higher threshold.
* **Range 1 color** — the color shown when the score meets or exceeds **Range 1**'s minimum.
* **Range 2 minimum value** — the score must be at or above this value but below **Range 1** for **Range 2**'s color to apply. Set this as the lower threshold.
* **Range 2 color** — the color shown when the score falls in **Range 2**.

#### Drilldown

* **Drilldown fields** — the columns shown when a user clicks the widget to see the underlying responses.
* **Drilldown sort field** — which field the list is sorted by when it opens.
* **Drilldown sort order** — ascending or descending.

### History chart widget

Customer

Plots how a numeric field has changed over time, displayed as a bar chart. Each bar represents one month. Use this to track trends such as ARR growth month over month.

#### Filtering

* **Filter condition** — defaults to "Empty filter (all items will match)". Click to add conditions — for example, only include customers with a specific status or tag.
* **Current standard filter** — optionally link to a saved filter from your account.

#### Data settings

* **Report type** — Sum or Average. Controls whether values are added together or averaged across each interval.
* **Field** — the numeric field to plot (e.g. ARR). Click Edit to change it.
* **Number of intervals** — how many months to display (default: 12).

#### Visual settings

* **Color** — the color theme for the bars: Blue, Green, Red, Purple, or Indigo. Select Custom color to pick your own.
* **Custom bar color** — only visible when Custom color is selected.
* **Number color** — the color of the value labels shown on the bars.

#### Drilldown

* **Drilldown fields** — the columns shown when a user clicks a bar to see the underlying records for that month.
* **Drilldown sort field** — which field the list is sorted by when it opens.
* **Drilldown sort order** — ascending or descending.

### Report graph widget

Customer

Shows how customers are distributed across value groups over time as a stacked or grouped bar chart. Each bar represents a month. Each segment shows how many customers fell into each group during that period. Use it to track how the health or status of your customer base shifts month by month.

#### Filtering

* **Filter condition** — defaults to "Empty filter (all items will match)". Click to add conditions to narrow which customers are included.
* **Current standard filter** — optionally link to a saved filter from your account.

#### Graph settings

* **Graph report field** — the field whose values are used to categorise customers into groups each month. Works well with health scores and custom fields.
* **Month count** — how many months of history to display.
* **Value groups** — define which field values map to which named groups, for example value `3` → `Good`. Each group has a name, a value, and a style — **Good** (green), **Fair** (yellow), or **Poor** (red) — that sets its colour.

#### Style

* **Widget name** — the label shown at the top of the widget.
* **Height** — controls how tall the widget renders on the dashboard (`1`–`5`).

### Horizontal bar chart widget

Customer

Shows customers grouped by status as a list of horizontal bars. Each row represents one customer status with a count and combined ARR. Click a row to expand an inline list of the customers in that status.

#### Filtering

* **Filter condition** — defaults to "Empty filter (all items will match)". Click to add conditions, for example only include customers assigned to a specific team or above a certain ARR threshold.
* **Current standard filter** — optionally link to a saved filter from your account.

#### General settings

* **Comparison time ago** — how many units back in time to compare against, for example `1`. Used to show whether a status has grown or shrunk.
* **Comparison unit** — **Day**, **Week**, or **Month**.
* **Show percentage of ARR** — when enabled, the percentage shown on each bar is calculated from ARR rather than customer count.

#### Drilldown

* **Drilldown fields** — the columns shown when a user clicks a status row to see the underlying customers.
* **Drilldown sort field** — which field the list is sorted by when it opens.
* **Drilldown sort order** — ascending or descending.

### Grouped data widget

Customer & User

<figure><img src="/files/UUebj6foKPMvn2ODmXIj" alt=""><figcaption></figcaption></figure>

Splits your records into colour-coded groups and shows a count for each. The default configuration groups customers by usage health (Good, Fair, Poor), but you can reconfigure the groups to reflect any categorisation that matters to your team — such as customer tier, onboarding stage, or NPS band.

#### Filtering

* Same filter condition and standard filter options as the KPI Widget.

#### General settings

* **Field** — the field used to categorise records into groups (e.g. Usage health). Click Edit to change it.
* **Show results as percentages** — Yes / No toggle. When enabled, each group shows a percentage of the total rather than a raw count.
* **Data groups** — define up to three groups. Each group has a name (the label shown on the widget), a value (the field value that maps records to this group), and a style that controls the bar color — Good (green), Fair (yellow), or Poor (red). Use **+ Add group** to create additional groups.

#### Drilldown

* Same drilldown fields and sort field options as the KPI Widget.

***

## Common scenarios

### Track customers up for renewal this quarter

A CSM wants a dashboard tile showing how many customers renew in the next 90 days. They create a **KPI Widget** with Customer data, add a filter for renewal date within the next 90 days, name it "Renewals this quarter" in Style, and enable **Show comparison** with a 3-month interval to see whether the renewal pipeline is growing. The tile shows a live count that opens the full customer list when clicked.

### See where customers sit across health tiers

The CS team lead wants a single tile showing how many customers fall into Good, Fair, and Poor health. They create a **Grouped data widget** with Customer data, set **Field** to Usage health, and leave the default groups in place. Enabling **Show results as percentages** makes it easy to communicate portfolio health in team meetings without sharing raw numbers.

### Track health distribution over time

The CS lead wants to see whether more customers are moving into Poor health over the past six months. They create a **Report graph widget** with Customer data, set **Graph report field** to the health field, define value groups for Good, Fair, and Poor, and set **Month count** to `6`. The chart shows whether the portfolio is improving or slipping month by month.

### Visualise renewal spread across the coming months

A team lead wants to see the renewal pipeline spread across the next 12 months. They create a **Time graph widget** with Customer data, set **Field** to the renewal date field, keep **Interval unit** as Month(s) and **Number of intervals** at 12, and enable **Show future data**. The resulting bar chart gives an immediate view of which months carry the heaviest renewal load.


# Weekly digest - Executive Report

The state of your customer base, delivered to your inbox every Monday morning without anyone having to build it.

**Where to find it:** Apps → Startdeliver Executive Report **Who can access it:** Admins configure. Any team member or external email address can receive it.

***

**What it is**

The Executive Report is a weekly email digest that summarizes the state of your customer portfolio — ARR, health changes, at-risk accounts, onboardings, expansions, contractions, and team activity — sent automatically every week to whoever needs to see it.

<figure><img src="/files/mcaslGmmLD68klpcpQhK" alt=""><figcaption></figcaption></figure>

It is designed for CS leaders, CEOs, CROs, and founders who want a current pulse on the customer base without logging into the platform. One email, once a week, with everything that matters.

***

**What the report covers**

Each section of the report is configurable — include what's relevant, exclude what isn't.

**ARR** — Total ARR with a bar chart showing the trend over your configured period (6 or 12 months). YTD expansion alongside total customer count.

**Usage health** — Changes in usage health across the portfolio since last week. Which customers improved, which declined, and how the overall distribution has shifted.

**Experience health** — Changes in feedback health. New survey responses that moved customers between Good, Fair, and Poor.

**Support health** — Changes in support health. Tickets opened, resolved, and overdue.

**At-risk customers** — Which customers became At Risk this week. Which customers are no longer At Risk. The change in your at-risk population.

**Onboardings** — Active onboarding customers and their current status.

**Expansions and contractions** — ARR changes from the previous week — new expansion, contraction, and the net movement.

**Team member activity** — What your CSMs did last week — interactions, tasks completed, projects advanced — by individual or team.

***

**Setup**

Go to Apps → Startdeliver Executive Report.

<figure><img src="/files/NN3LvQ56YaxNdq7pEBhV" alt=""><figcaption></figcaption></figure>

**Enable the report** — toggle on.

**Choose recipients** — select team members from the dropdown, or enter any email address directly. You can send to people outside Startdeliver — a CEO, a board member, a CRO — without them needing a platform account.

**Configure each section** — for each of the six report sections (ARR, Usage, Feedback, Support, At Risk, Onboardings, Expansions), choose whether to include it, whether to show history, and whether to override the default customer filter with a custom one.

**Test before sending** — use Send me a test email to preview exactly what recipients will see before enabling the live report.

***

**Common configurations**

**For a CEO or founder** Enable ARR with 12-month history, At-risk customers, Expansions and contractions. Disable team member activity. Keep it to the business metrics that matter at the top level.

**For a Head of CS** Enable everything — ARR, all health sections, At-risk, Onboardings, Expansions, and team member activity. This is the full picture of the portfolio in one email.

**For a board or investor update** Enable ARR trend and Expansions and contractions only. Clean, revenue-focused, no operational detail.


# API, MCP & Developer tools

Startdeliver is built to be integrated with. A full REST API, usage event tracking, webhook support, and MCP — everything your technical team needs to connect Startdeliver to your stack.

***

**The Startdeliver API**

Startdeliver provides a fully-featured REST API covering every core object in the platform. The API is available to all customers and is the foundation for custom integrations, data pipelines, and building your own apps on top of Startdeliver.

**What the API covers:** Customers, Users, Team members, Projects, Tasks, Custom fields, Usage events, Support tickets, Feedback, Files, Products, Usage types, and Customer status.

**Full API reference and guides →** [developer.startdeliver.com](https://app.startdeliver.com/dev)

***

**Usage events**

Usage events are how your product sends activity data to Startdeliver — the raw signals that feed product usage health and the AI assessment. Every feature interaction, login, or custom event your product tracks can be sent to Startdeliver via the Usage API or the JavaScript library.

→ [Usage API documentation](https://app.startdeliver.com/dev) → [JavaScript library](https://app.startdeliver.com/dev)

***

**Webhooks**

Startdeliver supports webhooks for real-time event handling — receive notifications when customers, users, or other objects are created or updated. Useful for keeping external systems in sync without polling.

→ [Webhook documentation](https://app.startdeliver.com/dev)

***

**Building apps**

The Startdeliver App Directory lets you build and install custom apps that extend the platform. If you have a tool that doesn't have a native integration, you can build a connector using the API and distribute it through the app directory.

→ [App Directory](https://app.startdeliver.com/dev) → [Browse existing apps](https://app.startdeliver.com/apps)

***

**MCP server**

Startdeliver exposes an MCP server for AI tools and assistants.

Use it to connect compatible AI tools to Startdeliver with OAuth or a bearer token.

Claude, Claude Code, and ChatGPT are common examples.

→ [MCP - Model Context Protocol](/jecta-agent-and-ai/mcp-model-context-protocol) → [MCP server guide](https://app.startdeliver.com/dev/tutorial/mcp-server)

***

**Developer portal**

Everything above lives in the Startdeliver developer portal — including the full API reference, guides, code examples, and libraries.

**→** [**Open developer portal**](https://app.startdeliver.com/dev)


# Changelog

New updates and improvements

{% updates format="full" %}
{% update date="2026-05-22" %}

## MCP now works with ChatGPT and Claude

<figure><img src="/files/eVgdlP6LnnNcx2pQigEI" alt=""><figcaption></figcaption></figure>

Startdeliver now connects to OpenAI ChatGPT and Anthropic Claude via MCP (Model Context Protocol).

Work with your customer data, tasks, and projects directly inside the AI tools you already use.

***

#### What you can do

* Query your customer portfolio, health signals, and tasks from inside ChatGPT or Claude.
* Ask questions about your customers and get answers grounded in your real data.

<a href="/spaces/ttka6LKL3bc1LsaDzuI5/pages/NxmZh5OdDoXzuR2Q6sCz" class="button primary">Read more</a>
{% endupdate %}

{% update date="2026-05-08" %}

## Flexible email automations

<figure><img src="/files/cNAXXufsx44IGXvLi0QB" alt=""><figcaption></figcaption></figure>

Automated emails now support more flexible delivery.

* Add **TO**, **CC**, and **BCC** beyond the primary recipient.
* Send from the customer's assigned team member.
* If no one is assigned, Startdeliver falls back automatically.
* Mass emails can now be sent to multiple recipients in a single email

<a href="/pages/PYmT3mSQu4fl4urbmMrw" class="button primary">Read more</a>

***

#### More precise access control

<figure><img src="/files/2nOs3H8vEAz0AlLrvgSK" alt=""><figcaption></figcaption></figure>

Permissions now support narrower scoping.

* Filter permissions across entities.
* Filter permissions across general objects.
* Whitelist one specific object, like a single project template for a partner.

<a href="/pages/0180627e1893f3de92d923595e201aede814db57" class="button primary">Read more</a>

***

#### Dashboard widget updates

<figure><img src="/files/LNdJcOKHP31cV89tvqN2" alt=""><figcaption></figcaption></figure>

Widgets now give you more control and better readability.

* Set custom bar colors in multi chart widgets.
* Get improved drilldown highlighting in multi chart and history chart widgets.
* Group grouped data widgets by text fields.

<a href="/pages/028ae005bbf15e1ae3026cdae69af6f7bef20c60" class="button primary">Read more</a>
{% endupdate %}

{% update date="2026-04-17" %}

## AI Health Assessments

<figure><img src="/files/U1psTyJjsF00wDRKjOBw" alt=""><figcaption></figcaption></figure>

Jecta now reads the full picture of every customer — usage, support, feedback, revenue, and interactions — and produces a plain-language assessment of where they stand and what to do next.

The assessment updates **automatically** when new data comes in. No triggers, no forms.

***

#### Make it yours

Add your own **instructions** so assessments reflect what health actually means for your business.

Find it in **Settings → AI → Overview**.

***

#### Credits

AI assessments run on credits. Every account includes credits to get started.

Top up anytime in **Settings**.

***

<a href="/pages/HFF4wLSxNtheJhV0rsRY" class="button primary">Read more</a>
{% endupdate %}
{% endupdates %}